With only few months until the CECL implementation deadline of January 1 2020 for SEC filing banks, the latter should be currently undertaking parallel runs, performing model validation, and updating their financial reporting as the standard has introduced new requirements for disclosures. According to FASB ASC 326-20-50-2, the disclosures should enable users of the financial statements to understand the changes in the estimate of expected credit losses that have taken place during the period, so not only for “Day 1” impact but also “Day 1”-to-“Day 2”.
- Macroeconomic scenarios are one of the key drivers of the reasonable and supportable forecasts for the ACL estimation. How will banks disclose information about the scenario(s) that they used?
Best practice for disclosures under IFRS9, a similar accounting standard that came into effect internationally on January 1 2018, has been the disclosure of the significant assumptions underlying the determination of each scenario (IFRS9 requires more than one scenario). Some banks have provided these assumptions for key geographical areas or portfolios, see for example Scotiabank. Thus, this is the information we have been providing to our IFRS9 clients.
- What about the disclosures for the R&S forecasts from the regional and community banks? The perennial question is whether national macroeconomic scenarios are relevant to the collectibility of their portfolios given the local geographical footprint of those institutions. After all, this “relevance” test is what regulators and auditors expect to see according to their proposed rule and guidelines.
The above question is very timely as the likelihood of a US recession in the next 12 months dropped this month. Figure 1 shows the probability of a US recession having dropped to 29% from 35% in the previous month. This probability is estimated by the New York Fed using the Treasury spread. Similarly, in the survey of economists by the Wall Street Journal, the average probability of a US recession fell to 30% from 34% in the previous month as depicted in Figure 2.

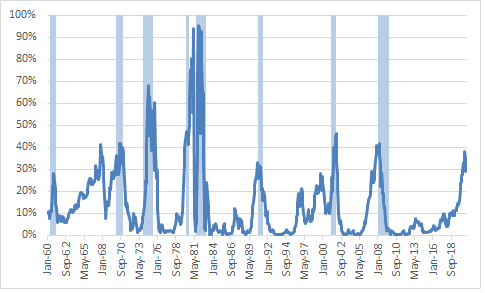
Figure 1. Probability of US Recession predicted by Treasury Spread (NY Fed)
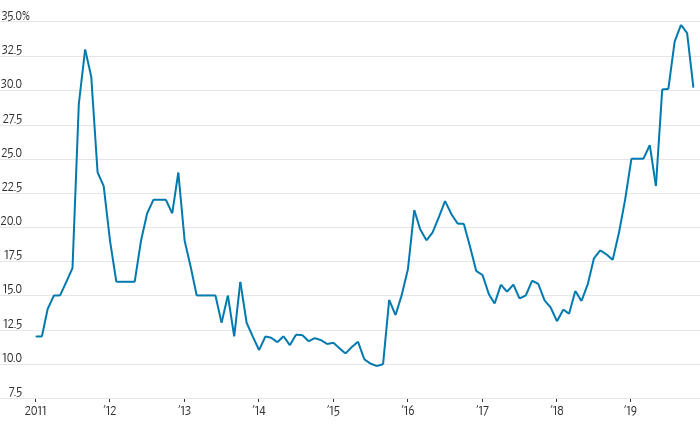
Figure 2. Average Probability of US Recession in WSJ survey of Economists
- Does this improvement for the likelihood of a US recession apply to all the States? Is the economy in certain States getting worse? Could some States already be in a recession?
For example, based on the NBER definition of two consecutive quarters of inflation-adjusted negative growth, Missouri has had 4 recessions, Connecticut 3, New York 3, Illinois 2, and California none since June 2009 (end of the Great Recession).
Downturns may be more concentrated than of a US-wide recession such as the Great Recession. Thus, in the 2001 recession States with more exposure to manufacturing were hit harder. Similarly in the energy driven recession of 2015-2016, the energy producing states were mostly affected.
- What are the current conditions and expectations for the State economies and how different are they? Answering this question is key for formulating relevant scenarios for regional and community banks operating in them.
The Chicago Fed produces an index (MEI) designed to measure growth in nonfarm business activity in the Midwest and a relative one that measures growth conditions in Midwest relative to those of the nation. Positive values of the relative index are associated with above-average growth and negative values with below-average growth. In September MEI fell to its lowest level since the Great Recession, -0.43. The relative index fell to -0.44, as shown in Figure 3, indicating worse growth conditions relative to the nation.
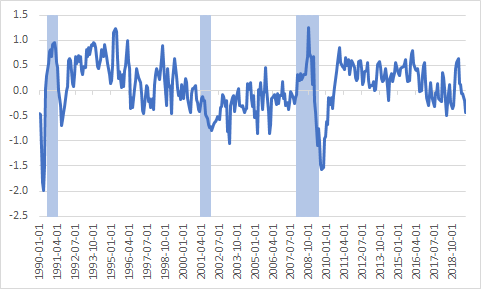
Figure 3. Relative Midwest Economy Index from Chicago Fed
In addition, the Chicago Business Barometer produced by ISM and MNI, fell 3.9 points to 43.2 in October, the lowest level since December 2015, the start of last two-quarter recession in the State of Illinois.
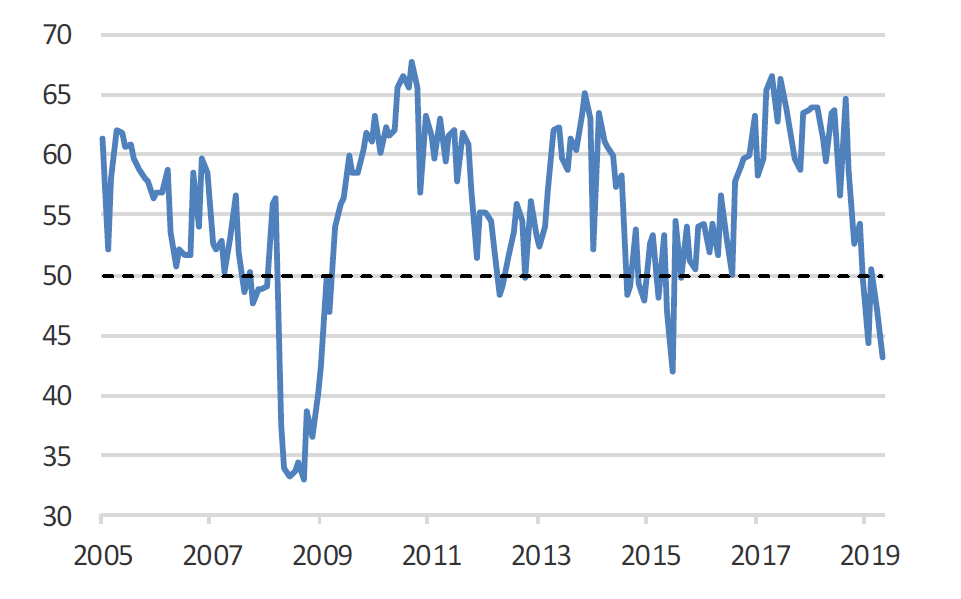
Figure 4. The Chicago Business BarometerTM from ISM-Chicago Inc and MNI
Figure 5 depicts the y/y change in the Leading Index across States as of 2019 Q3. Most of the States are now exhibiting higher deterioration than the y/y change of the US Leading Index; the bluer the color, the higher the deterioration. The Midwest states are also exhibiting deterioration in future conditions according to their respective leading indices.
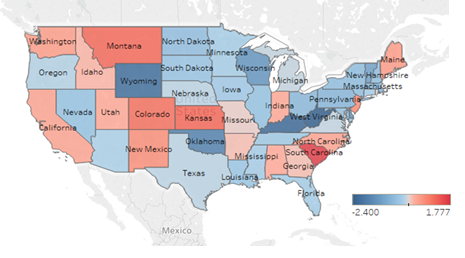
Figure 5. Y/Y Change in US Leading Index – 2019Q3
- Given the above significant heterogeneity in current and expected conditions across the US, regional and community banks should use scenarios for their local economy in order to pass the “relevance” test for the regulators and auditors.
- Furthermore, using scenarios for the national economy would increase the loss forecast error and introduce procyclicality in their provisions and earnings volatility when the downturn in their State occurs.

