The Coronavirus Aid, Relief, and Economic Security Act (CARES Act) introduced the Paycheck Protection Program (PPP) to provide economic relief to small businesses adversely impacted by the COVID-19 crisis. The first phase of PPP only lasted for two weeks as its initial fund of $339 billion was exhausted. The second phase of PPP with an allocation of $310 billion started on April 27 and is still underway.
Although the program has been marred by technical glitches, fraud allegations and complaints for preferential treatment on banks’ lending decisions, it should be praised for its rollout speed. It has provided over 1.6 million loans in its first round with an average loan size of $206,000, and over 2.2 million loans in the second round up to May 1 with an average size of $79,000.
It has also helped community banks strengthen and in some cases grow their customer base amidst the crisis, particularly during the second phase where 32% of the approved dollars have come from banks with <$10 billion in assets. In addition, according to American Banker, the fees from the program are expected to cover some of the higher loan-loss reserves due to the COVID-19 induced recession.
Due to the crucial role of small businesses in the US economy, it is important to evaluate the effectiveness of the PPP program. As some states have been hit harder than others from COVID-19 – such as NY, NJ, MI and PA – the effectiveness of the program will have a bearing on the recovery of those states. This will therefore affect regional economic scenarios that financial institutions are using for business planning, loss reserving and capital planning.
In a previous RMA article we evaluated the effectiveness of the first phase of PPP along the following questions:
- Are there any differences across states in how the PPP funds have been distributed?
- Have states with higher concentration of small businesses or financial institutions received more funds?
- Have states hit with higher unemployment received a bigger portion of the fund?
In this article we provide an update on the evaluation of the two phases combined.
Q1. Were there any differences across states in how the funds of PPP 1+2 have been distributed?
Figure 1 shows that CA, TX, NY, FL and IL have remained the top five states in disbursement, with rates of 12.91, 8, 7.36, 5.83 and 4.37% respectively. This is not surprising as these five states are the top states by GDP. NJ, MI and PA three states that have been particularly hit by the pandemic ranked eighth, ninth and sixth respectively.
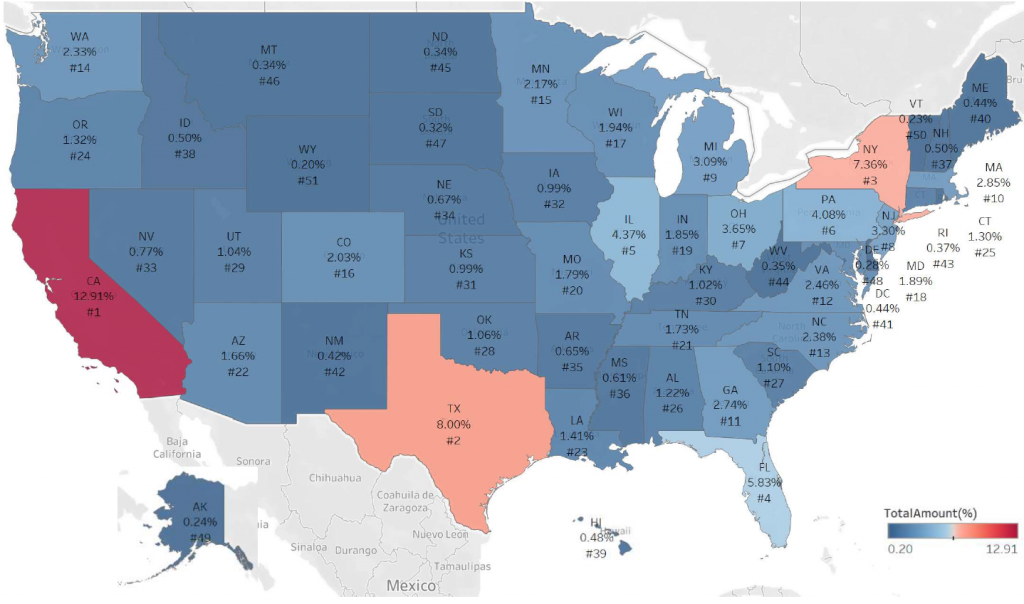
Figure 1. Distribution of the PPP fund across States
Q2. Did states with higher concentration in financial institutions attract more funds?
Figure 2 shows the distribution of the amount by number of financial institutions for each state. It averages between $13 million – 155 million. CA and FL maintain their status in the top-five states, in the second and third spot respectively. However, similarly to the first phase, TX ranked 24th, NY 11th and IL 30th, compared to second, third and fifth place based on disbursement rate. These differences illustrate the concentration of the disbursements by a relatively small number of banks within these three states. In contrast, AZ has continued being at the top, NV ranked fourth (up from seventh) and NC fifth (down from fifth).
Thus, as previously concluded, there is no significant relationship between number of financial institutions and funds absorbed per state. States with fewer institutions managed to absorb more funds.
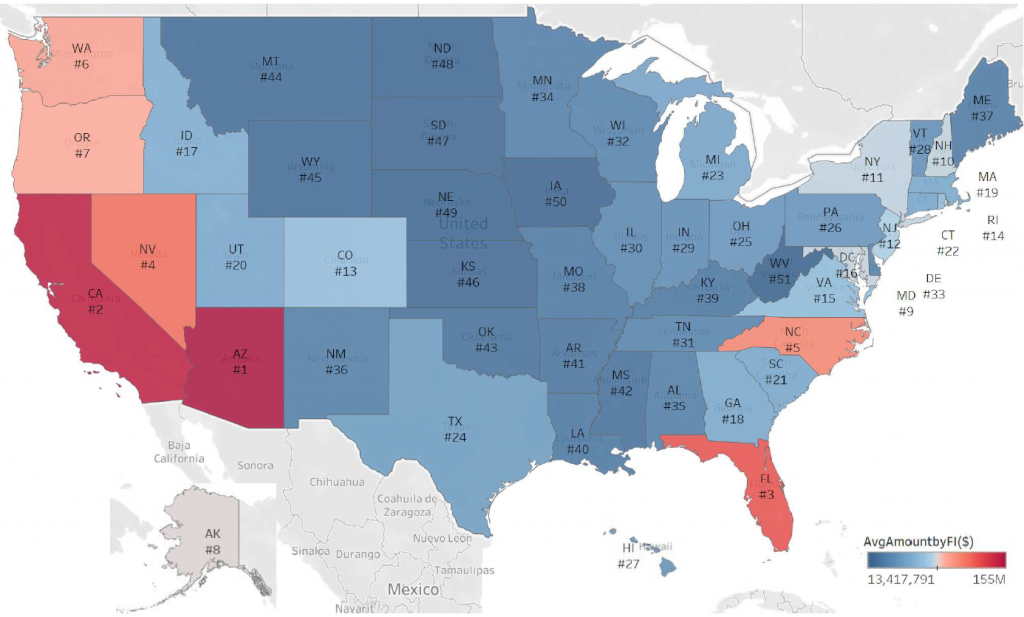
Figure 2. Distribution of the Average Amount per Financial Institution across States
Q3. Did states with higher concentration of small businesses receive more funds?
Figure 3 depicts the distribution of the loans per small business, based on data from SBA for the number of small businesses per state from US Census. As in the first phase, states with relatively higher concentration of small businesses had low coverage of PPP loans.
The top five states in terms of small business coverage remained the ones in the Great Prairies, i.e. ND, SD, NE, IA (previously sixth) and WY (previously fourth). The top five states in number of small businesses, CA, TX, FL, NY and IL, ranked 48, 43, 47, 45 and 31 respectively. Since these states have had lockdowns their small businesses are expected to have been hit harder compared to states in the Great Prairies that did not even have statewide lockdowns.
The dominance of the Great Prairies states in the small business coverage of the PPP program is corroborated by a US Census Small Business Pulse Survey. It is a special weekly survey for measuring the changes in business conditions on our nation’s small businesses during the coronavirus (COVID-19) pandemic. The results from the first week of the survey, April 26 to May 2, were recently published. Figure 4 shows the percentage of small businesses per state that responded as having received PPP assistance. The rankings of the states in Figure 4 are more important than their absolute response percentages since the survey may be subject to non-response bias due to COVID-19 according to US Census. Thus, a comparison between Figures 3 and 4 confirms the top ranking of the Great Prairies states as well as the low ranking of CA, TX, FL and NY.
When we examine the loan amount per small business employee in Figure 5, we observe that the patterns are different from the coverage patterns and also different from phase one. There is dispersion across states as before but the Northeastern states have significantly improved. MA ranks first (up from sixth) NJ ranks second (up from 38th) and NY ranks sixth (up from 42nd). UT, CO and CA rank third, fourth and fifth. These results are encouraging as the aforementioned states with the exception of UT were in lockdown and have just started to reopen. Therefore, the small businesses in these states are expected to have been hit hard. It is worth noting that the Great Prairies states now rank much lower than they used to be before in terms of loan amount per small business employee.
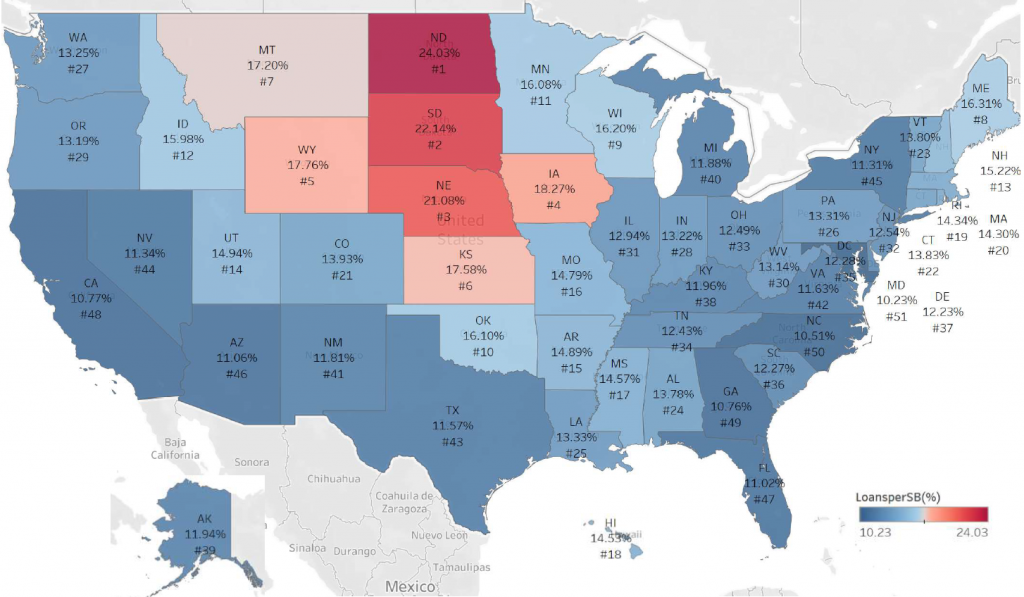
Figure 3. PPP Coverage of Small Businesses across States
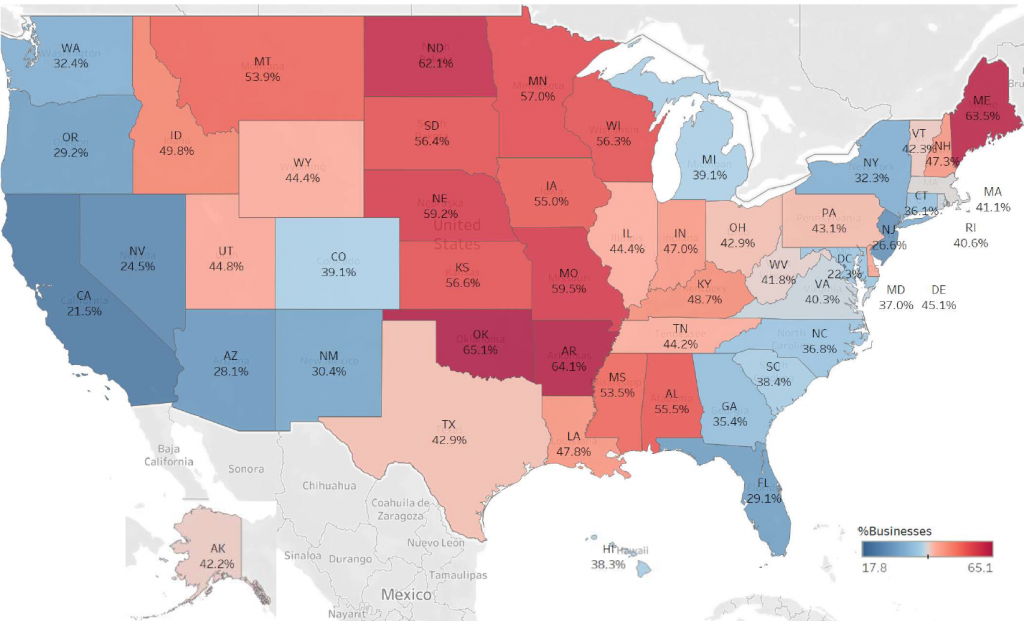
Figure 4. US Census Small Business Survey for Received Assistance for PPP (Apr 26 to May 2 – US avg. 38.1%)
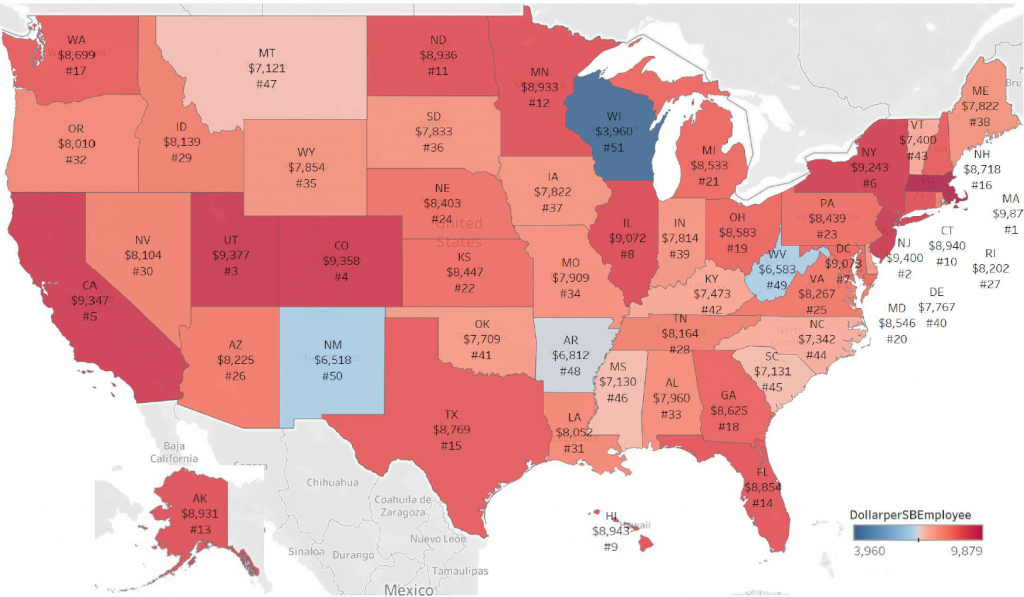
Figure 5. Distribution of the Loan Amount per Small Business Employee across States
Q4. Did states with higher unemployment receive more funds?
The implied monthly unemployment rate is defined as the ratio of the cumulative weekly unemployment insurance claims during the period March 20 to May 9 to employment. It is depicted in Figure 6.
As previously, states which have been severely hit by unemployment claims during the above period – i.e. KY, GA, and RI ranking first, second and fifth – ranked very low in the small business coverage and absorption of the fund. On the other hand, the Great Prairies states that ranked at the top in terms of small business coverage have had relatively low implied unemployment rate.
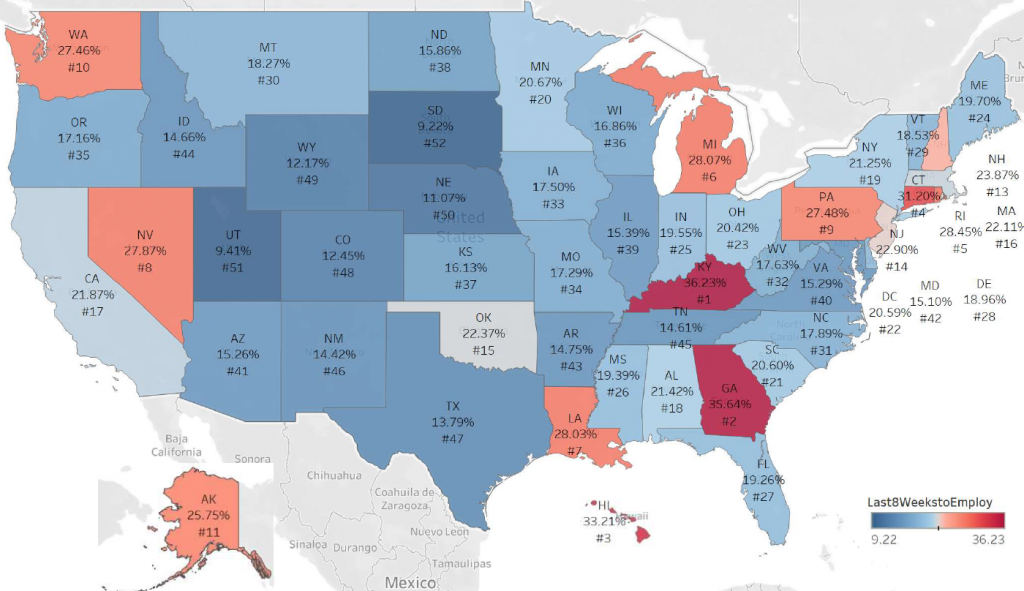
Figure 6. Implied Unemployment Rate (Mar 20 – May 9)
Concluding Remarks
- The distribution of the PPP fund from the two phases is quite uneven across states. Most of the patterns have remained the same as in Phase 1. The Northeastern states have significantly improved from Phase 1 in terms of loan amount per small business employee. NY has had the biggest improvement, ranking sixth up from 42nd.
- As previously concluded, the distribution of the fund lacks a significant relationship with the number of small businesses and the implied monthly unemployment rate per state during the period of the two phases.
- The above raise concerns about the effectiveness of the program for helping small businesses and supporting a quick recovery of the state economies.
- These differences should be taken into account for the downturn and recovery trajectories of macroeconomic scenarios, particularly regional ones, that banks are using for business planning, loss reserving and capital planning.
Grigoris Karakoulas is the president and founder of InfoAgora (infoagora.com) that provides risk management consulting, predictive risk analytics, price optimization, scenario generation and CECL/stress testing solutions, and model validation services. Contact him at grigoris@infoagora.com

