In a recent post we introduced our RMA journal article on the “Forbearance Cliff”, a cliff that banks and borrowers have been faced with as the corresponding accommodation programs expire. The article reviews the current state of forbearance by asset class for US banks, and discusses how the proper data and scenario analysis can be used to assess the risk of the loans involved.
- What is the forbearance experience in Canadian Banks and how does it compare with their US counterparts?
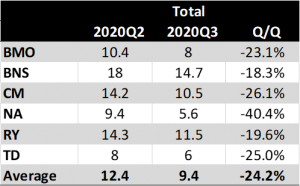
In the week of August 24 the Big 6 Canadian Banks reported their (July 31) Q3 results. Table 1a provides the breakdown of deferrals by asset class and bank as a percentage of the respective portfolios for the last two quarters. “Total Consumer” refers to All Retail including residential mortgages. This is provided for comparison purposes with the US banks as discussed below. Table 1b provides the percentage of deferrals overall by bank.
The two tables confirm the downward trend of deferrals that was reported by the US banks in their Q2 earnings. Table 1a shows that the biggest q/q drop on average was in commercial loans at -43%. On the other hand, residential mortgages had the smallest q/q drop at -17.1% on average. In fact, two of the banks reported no change or a slight increase to balances in deferral. In addition, all the banks except National Bank (NA) had double digit percentages of deferral for residential mortgages at the end of Q3, ranging between 11.7-17.7. National Bank reported a q/q decline of 58% in the deferrals for residential mortgages.
It is worth noting that in mid-July a few key mortgage lenders in Canada reported a much bigger drop in deferrals. Equitable Bank reported a decline in mortgage deferrals from 20% of the bank’s portfolio to just 6%. Similarly, Home Capital and First National reported a decline to 7.5% and 4.5%, about a third of their peak levels.
In contrast, in late August the Canadian Mortgage Housing Corporation (CMHC) announced that about 14% of its mortgages were in deferral at the end of July, with Alberta leading the pack at 21% due to the oil slump and Quebec having the lowest level at 5.6%. The latter level of deferrals is consistent with what was recently reported by National Bank.

Table 1a. Deferrals (balance %) by asset class for the Big 6 Canadian Banks

Table 1b. Total deferrals (balance %) for the Big 6 Canadian Banks
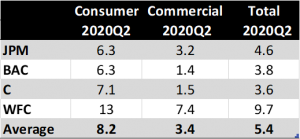
Table 2 shows the deferrals for the Top 4 US banks, as reported in their Q2 (June 30) earnings. Since the forbearance programs came into effect towards the end of Q1, Q2 was the first quarter with a complete picture of the extent of forbearance in US banks. For each of the four banks there is a breakdown for Consumer (including residential mortgages) and Commercial.
According to Table 2, at the end of June, the percentage of deferrals was in single digits on average for the top 4 US banks, for both Consumer and Commercial. The exception was Wells Fargo (WFC) with 13% for its Consumer portfolios. Furthermore, the top 4 US banks had almost half the level of forbearance that the Big 6 Canadian banks had at the end of July, with the biggest difference in Commercial loans.

Table 2. Deferrals (balance %) by asset class for the Top 4 US Banks
The Top 4 US banks did not provide a separate disclosure for deferrals for residential mortgages. However, the Forbearance and Call Volume Survey of the Mortgage Bankers Association reported that the share of loans in forbearance was at 7.16% as of August 30, down from its June peak of 8.55%. This is much lower than the share of deferrals reported by the Canadian banks.
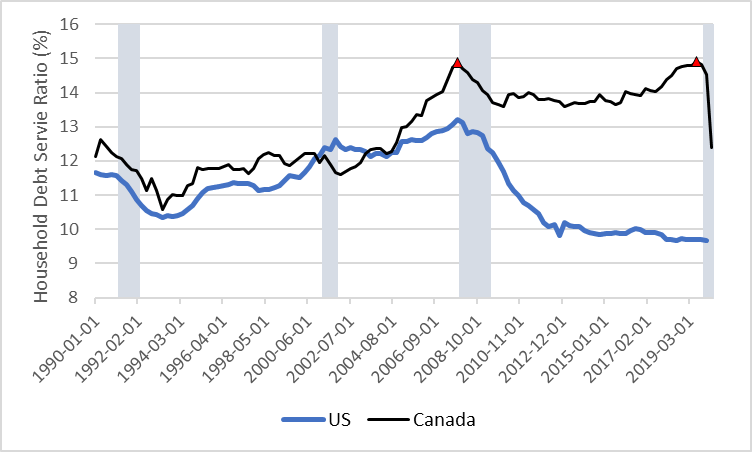
The higher level of forbearance for Consumer in the Big 6 Canadian banks vs. US could be significant due to the relatively higher level of household debt service ratio in Canada as depicted in Figure 1. The deleveraging of the Canadian consumer during and after the Great Recession was rather short-lived compared with the US consumer. This led to a widening of the gap between the two ratios in the last ten years.
Due to the COVID-19 fiscal stimulus programs and drop in interest rates, the ratio for Canada in 2020Q2 dropped 17% from its peak of the last 30 years, which has been reached twice in 2007Q4 and 2019Q3. The non-mortgage debt service ratio dropped more than the mortgage debt service ratio as credit card balances have significantly dropped since the lockdown. In both ratios, the increase in the household disposable income (denominator) was much bigger than the decrease in the debt obligations (numerator).
Thus, the historically low interest rates and relatively large share of government insured mortgages in Canadian banks provide a cushion for losses in residential mortgage portfolios. However, as the stimulus and forbearance programs expire and the foreclosure moratoria are lifted the debt service ratio may increase. This combined with the elevated unemployment rate could put more pressure on Consumer debt creating a cliff for Canadian banks.
- Hence, to deal with such uncertainty, as advocated in the aforementioned article, it is imperative for banks to use scenario-based assessment of the loans in forbearance for selecting the actions expected to minimize losses. The scenarios should reflect the differences in forbearance and recovery across asset classes and geographies as well as the effects from the expiration of the stimulus programs.

Figure 1. Household debt service ratio in Canada vs. US

