The Federal Reserve Board just released the scenarios for the second round of stress testing for the large banks.
https://www.federalreserve.gov/newsevents/pressreleases/bcreg20200917a.htm
The second round scenarios include two hypothetical scenarios with a severe recession, named Severely Adverse and Alternative Severe, as well as a baseline scenario.
- How do the second round scenarios compare with the first round?
- What do any differences imply for potential impact on the banks’ losses?
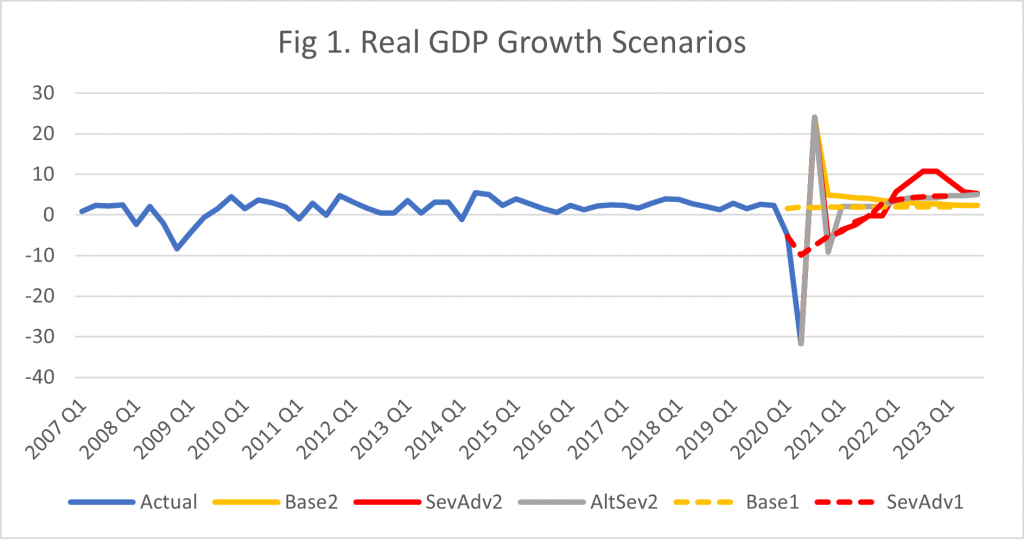
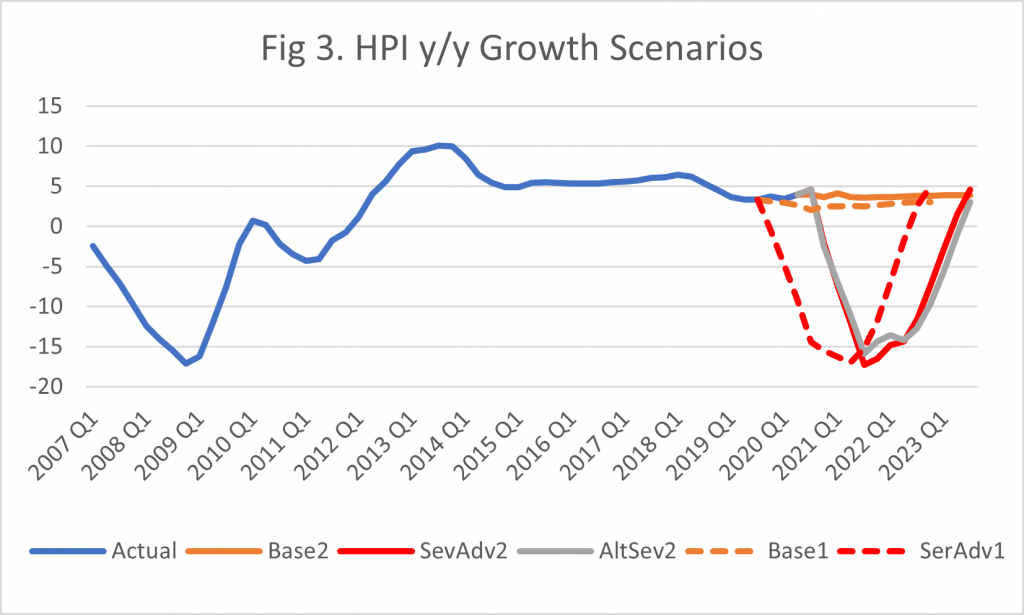
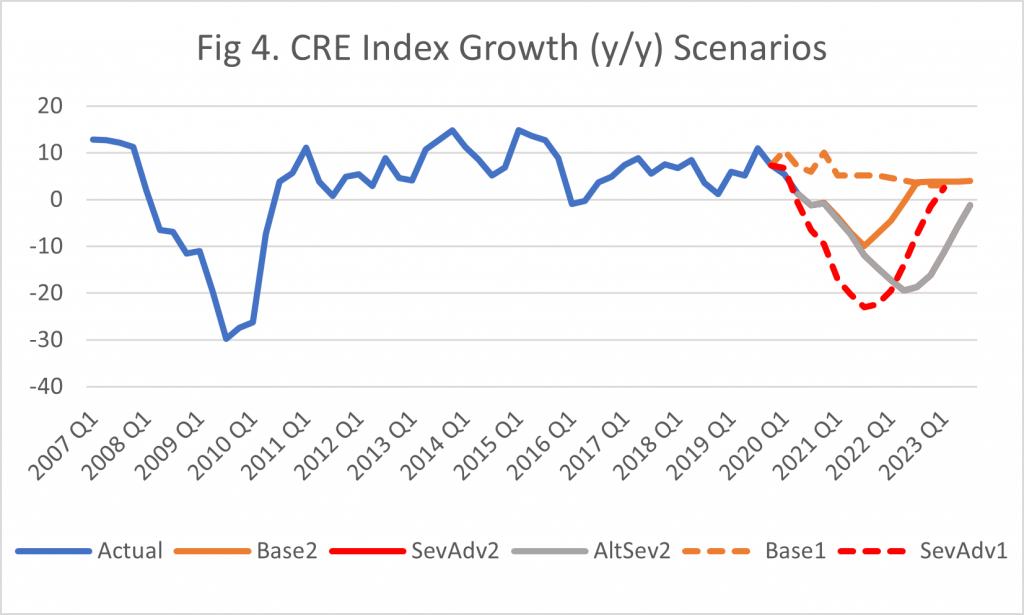
We next compare the two sets of scenarios for four macroeconomic factors: Real GDP, Unemployment rate, HPI and CRE Price Index. Figures 1-4 depict the comparisons per factor. Each Figure contains the “Base2”, “SevAdv2” and “AltSev2” curves for the second round scenarios, and “Base1” and “SevAdv1” for the first round.
Thus, in Figure 1, “Base2” exhibits a V-type of recovery for Real GDP that is completed by the end of 2021Q2 and thereafter evolves similar to the first round baseline scenario. The two adverse scenarios, “SevAdv2” and “AltSev2”, exhibit a distorted “W” shape. “SevAdv2” is longer than in “AltSev2” by a couple of quarters. The second leg of the “W” in the “SevAdv2” scenario lasts until 2023Q1.
The scenario curves for Unemployment Rate in Figure 2 show far more dispersion compared to the ones for Real GDP. The two adverse scenarios for Unemployment Rate follow an upside down “W” shape, mirroring the respective shapes for GDP.
- However, in contrast to the GDP scenarios, the two second round adverse scenarios do not converge to the baseline and lie significantly above the respective first round scenarios.
- Hence, the new scenarios for Unemployment Rate could trigger bigger losses, particularly for the Consumer portfolios.


In Figures 3 and 4, the second round scenarios for Residential and Commercial Real Estate follow a trajectory similar to the respective first round scenarios, except they are now shifted by two quarters. The recession/recovery path is similar to the one of the Great Recession, particularly for HPI.
- It is worth noting that, as shown in Figure 4, the “SevAdv2” and “AltSev2” curves for the CRE Price Index are exactly the same. This seems rather odd.
- In addition, the second round severely adverse scenario, “SevAdv2”, is slightly less severe than the respective first round, “SevAdv1”. This is despite the significant rise in serious delinquency currently underway, particularly for certain asset classes. On the other hand, the second round baseline scenario, “Base2”, reflects a price deterioration until 2020Q2 with a recovery thereafter. In contrast, “Base1” has a rather flat growth trajectory.


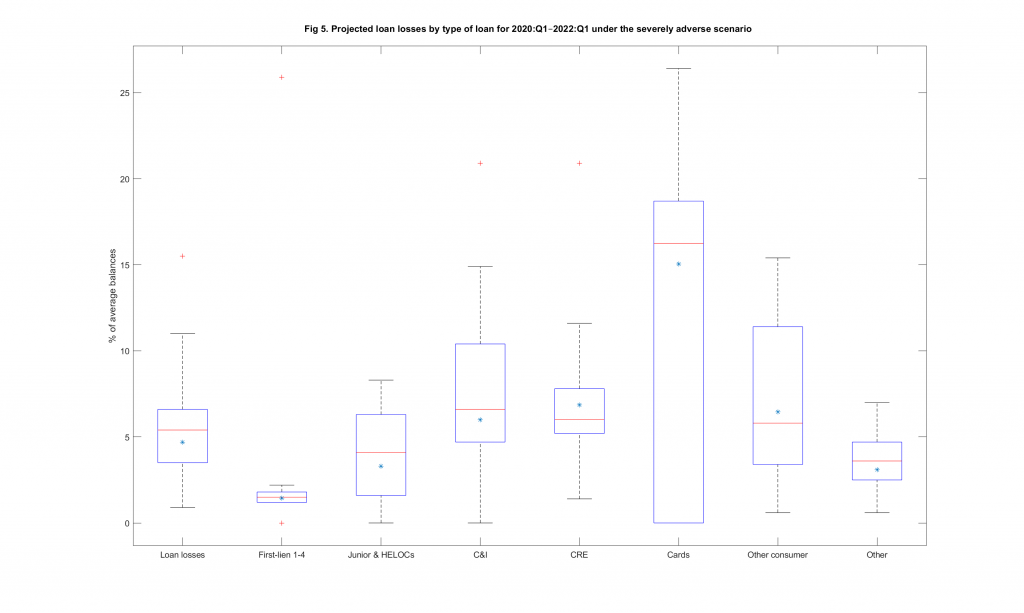
As a refresher of the first round of stress testing results, Figure 5 depicts a boxplot of the loss rate distribution by loan type for the 18 banks that participated in both the 2019 and 2020 DFAST Stress Tests. The box for each loan type represents the variability between the upper and lower quartile of the loss rate with the median indicated by a red line. The green star depicts the median loss rate for each loan type in the stress testing results of 2019.
- Thus, the overall loss rate for the group of 18 banks in the 2020 results was close to the 2019 results, only by about 7% higher than in 2019.
- CRE and Other Consumer were the two loan categories with a higher loss rate in 2019 than in 2020. We do not expect this to be the case in the second round of stress testing due to the differences in the new scenarios.
- Furthermore, the second round scenarios for Unemployment Rate could give rise to a much bigger loss rate particularly for Consumer portfolios.


