On February 12, the Federal Reserve Board released the hypothetical scenarios for CCAR 2021:
https://www.federalreserve.gov/newsevents/pressreleases/bcreg20210212a.htm
Although the scenarios are intended for testing the resiliency of large banks, the top 19 banks this year, they can provide a basis for the stress testing programs in regional and community banks. Of course, in those cases the stress scenarios should be adapted to the geographical footprint and lending profile of the respective banks.
Due to the uncertainty from the pandemic induced recession, the Federal Reserve introduced a mid-year stress testing in September 2020 with adverse scenarios that reflected a prolonged recovery. As we had expected at the time of our review of the mid-year scenarios, the latter resulted in a 19% ($82M) increase in losses over the original 2020 CCAR losses. 62% ($51M) of the increase was from CRE loans. This is the asset class that also scored the biggest change in losses (107%) over the 2020 CCAR results. First-lien mortgages and credit cards were the other two asset classes with the biggest changes reported, at 33% and 10% respectively.
Thus, we next review the 2021 scenarios by focusing on key macroeconomic factors and addressing two questions:
- How does the 2021 severely adverse scenario compare with the 2020 mid-cycle severely adverse scenario?
- What do any differences imply for potential impact on the banks’ losses?
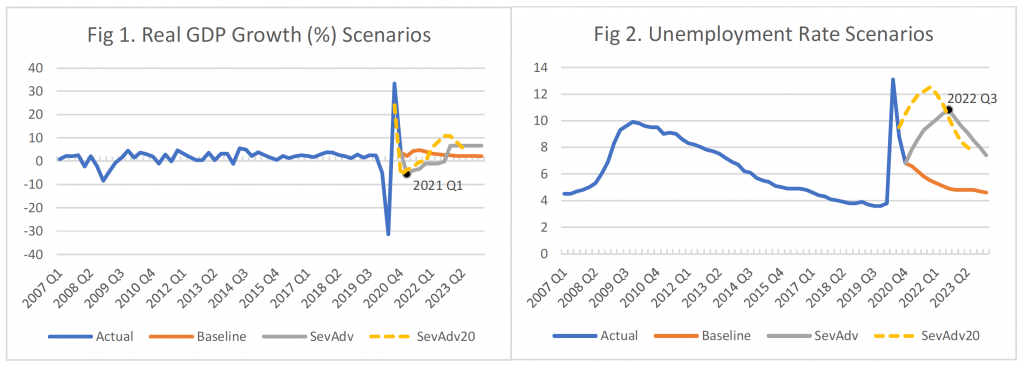
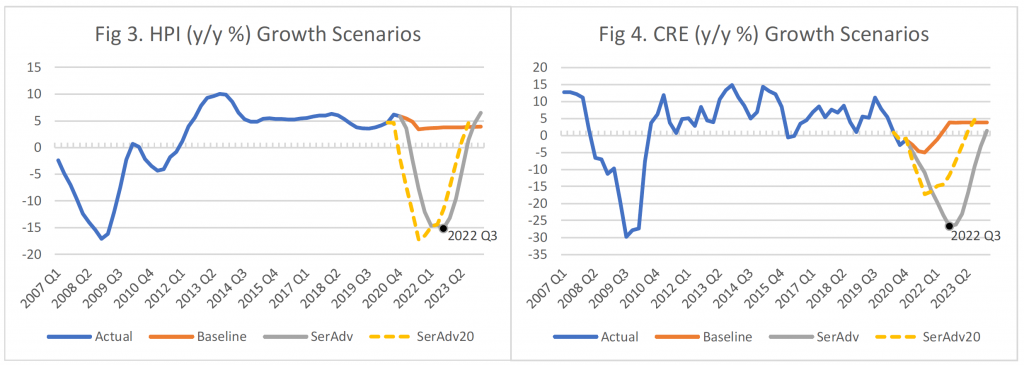
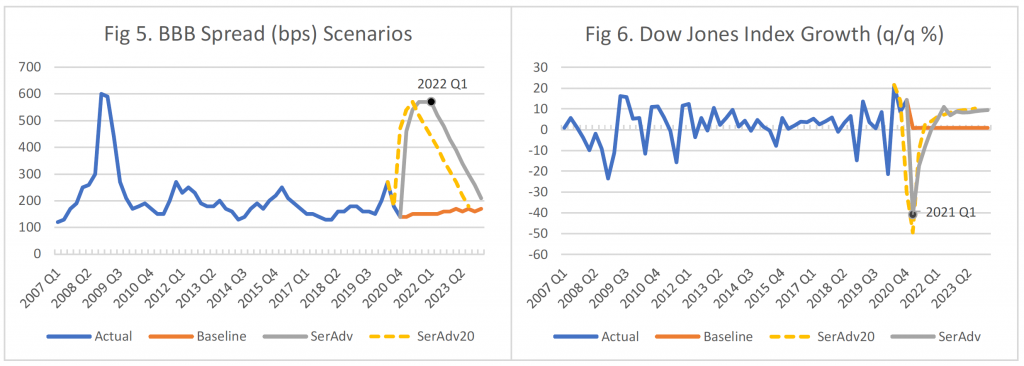
Figures 1-6 depict the scenarios for the following six macroeconomic factors:
- Real GDP in Figure 1
- Unemployment rate in Figure 2
- House price index (HPI) in Figure 3
- CRE Price Index in Figure 4
- BBB spread in Figure 5 and
- Stock market index in Figure 6
The 2020 mid-cycle severely adverse scenario is shown in dashed line in each figure. The quarter of the bottom/peak in the severely adverse scenario of each macroeconomic factor is also denoted.
- The 2021 severely adverse scenario for Real GDP bottoms in 2021Q1 at a value similar to the 2020 scenario but it exhibits a more prolonged recovery than the 2020 scenario and peaks at a value lower than the 2020 scenario. This implies a positive effect (increase) on losses compared to the 2020 mid-year losses, depending on the weighting of Real GDP in the loss forecasts.
- In contrast, Unemployment Rate in the 2021 scenario follows a faster recovery. It exhibits an inverse “W” shape but with a second peak, in 2022Q3, lower than the 2020 scenario. This implies a negative effect on losses.
- Similarly, HPI in the 2021 scenario bottoms, in 2022Q3, at a value slightly lower than the 2020 scenario. This implies a negative effect on losses.
- CRE price index in the 2021 scenario exhibits a more severe recession than the 2020 scenario. It bottoms in 2022Q3 at a value similar to the Great Recession and almost twice lower than the 2020 scenario. It also follows a slower recovery. This implies a significant positive effect on losses.
- BBB spreads widen similarly to the 2020 scenario but peak in 2022Q1 at a level slightly higher. Furthermore, they recover at a slower pace. This implies a slightly positive effect on losses.
- At the same time, the stock market return follows a trajectory similar to the 2020 scenario but bottoms in 2020Q1 at a level slightly lower than the 2020 scenario, i.e. 41% vs. 49%. This implies a slightly negative effect on losses.


Concluding Remarks
The above analysis indicates that the 2021 scenarios might lead to higher overall losses compared to the ones reported 2020 mid-year. They would mainly be driven by an increase in losses from CRE loans.
However, the referred CRE price index is an average across CRE asset classes. The impact on CRE from the induced recession has been asymmetric across asset classes, with hotel and retail bearing most of the brunt followed by office.
Using an average index for stress testing might be sufficient if a bank has a uniform portfolio mix across CRE asset classes. What happens if a bank, for example, has higher concentration in CRE retail, and/or in urban centers more hit by the pandemic and induced consumer behavior? In such cases, scenarios for more granular CRE indices should be used for better accuracy in the loss forecasts and impact on capital. The scenarios should be conditional on CCAR’s severely adverse scenario for the CRE index for consistency.
Moreover, as mentioned in the beginning, the above CCAR scenarios can form the basis for the stress test program in regional and community banks. To create relevant stress scenarios, however, one would have to adapt the scenarios to the geographical footprint and portfolio mix of the bank. This is a crucial step that we follow for our clients, given the asymmetry in the impact and recovery from the induced recession across geographies and asset classes.

