On June 24 the Federal Reserve released the results of its annual bank stress test:
https://www.federalreserve.gov/newsevents/pressreleases/bcreg20210624a.htm
The results have showed that all 23 banks that participated in this year’s exercise remained well above their risk-based minimum capital requirements.
In this article we delve into the results and highlight a few points:
- In contrast to last year’s test on 33 banks, 19 of the biggest banks were subject to the DFAST/CCAR examination under the rules finalized by the Fed in 2019. Superregional banks with assets between $100 billion and $250 billion are only required to undergo stress tests every other year. In addition, four firms chose to opt in to the 2021 exercise: BMO Financial, MUFG, RBC and Regions.
These four banks were motivated to join this year’s exercise in order to lower their stress capital buffer. The 2021 results seem to validate their decision as all four banks recorded a smaller deterioration in the CET1 ratio in this year’s stress test compared to last year’s. This is a key indicator of whether a bank will have its stress capital buffer lowered. The Fed will release the final capital plans in a few months before the stress capital buffer requirement is set to take effect in the fourth quarter.
- Given the aforementioned change in this year’s participation we had to extract the results of the 23 firms from the previous two exercises for consistency purposes. Figures 1-3 depict the breakdown by loan type of the projected losses under the severely adverse scenario in the last 3 stress testing exercises starting with the 2021 one. Please note that last year there was an extra mid-term stress test whose results were published in December 2020. Hence it is denoted as “Dec 2020” in the figures.
One of the significant changes in this year’s results was the reduction in projected losses for Credit Cards. In the previous two exercises Credit Cards had the highest losses by far than any other portfolio type. This change is to be expected given the significant reduction in outstanding balances in Credit Cards due to the pandemic.
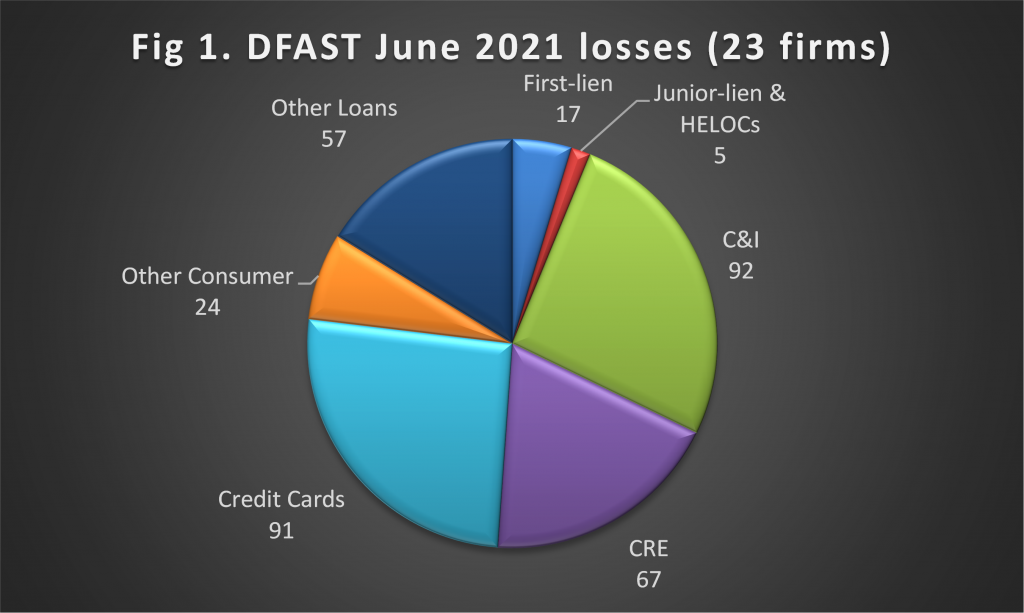
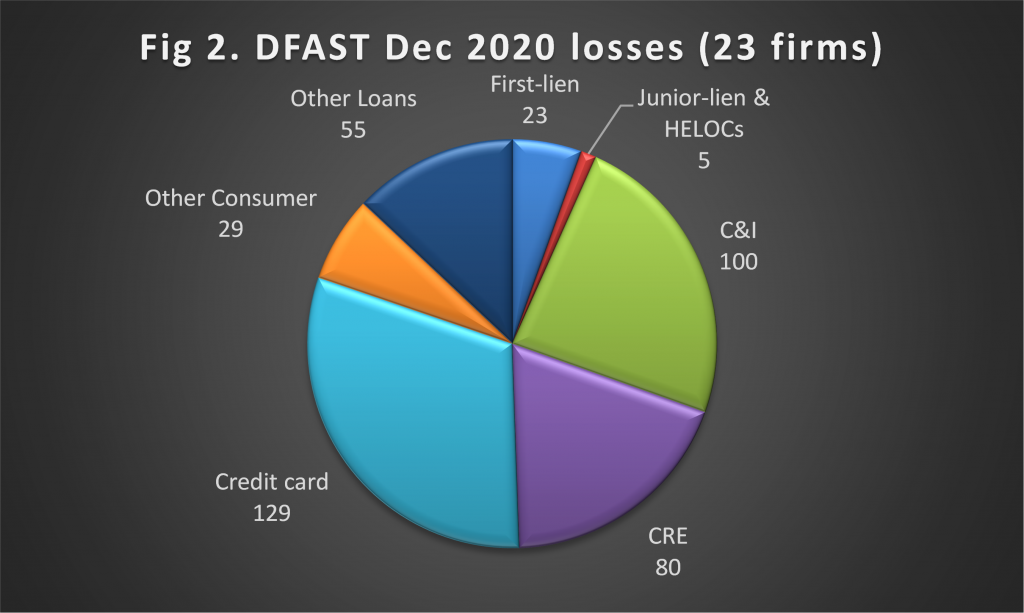
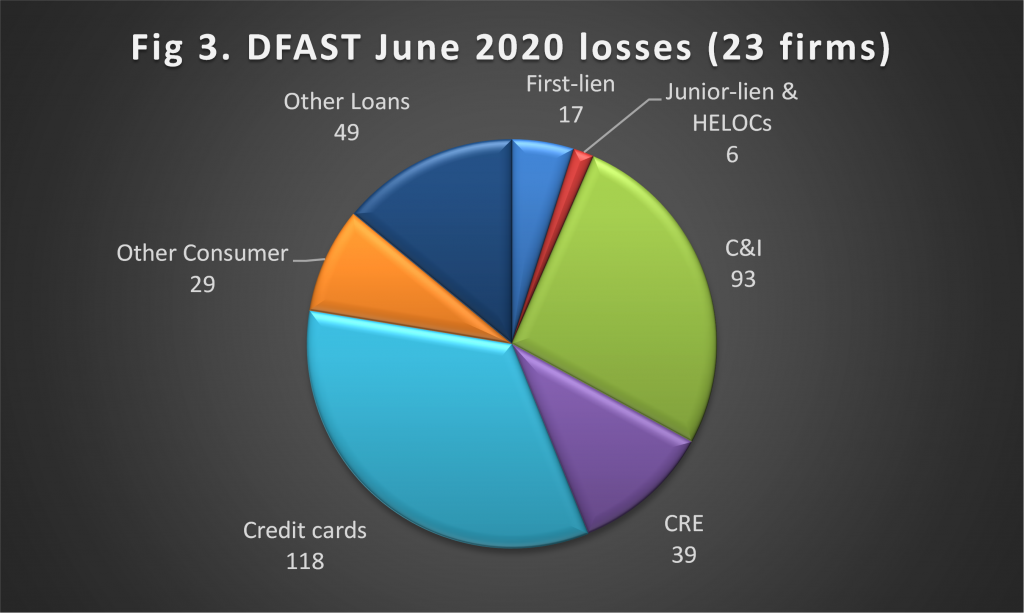
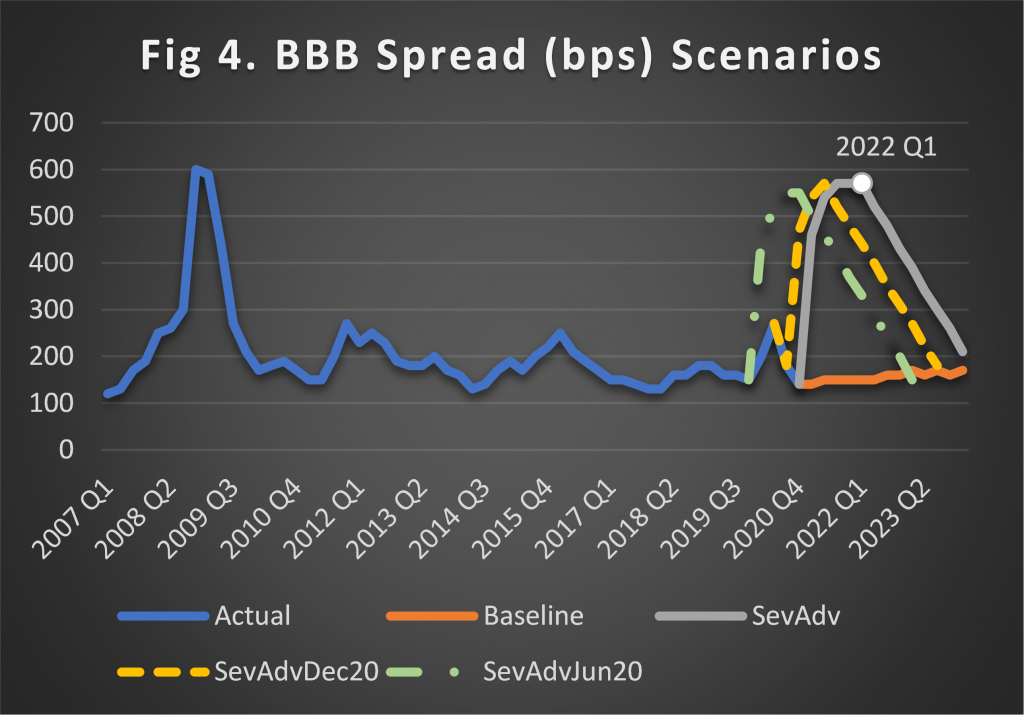
- One other change was that the highest losses this year were from the C&I portfolios at $92B, just a billion above the Credit Cards losses. In “Dec-2020” they were at $100B and in “June-2020” $93B. For reference purposes, we show the BBB spread in Figure 4 including its severely adverse scenarios of the last 3 exercises. The severely adverse scenarios of “June-2020” and “Dec-2020” are similar with the June-2021, except that the latter has the BBB spread peaking in 2022Q1 at a level slightly higher than the peaks of the other two scenarios as per our previous analysis. Furthermore, the BBB-spread in June-2021 recovers at a slower pace than in the other two scenarios.
Although the nonaccrual rate for C&I loans peaked in November 2020, there is still uncertainty in the recovery of some industries hit hard by the pandemic, i.e. “Mining, Oil & Gas”, “Arts, Entertainment & Recreation”, “Accommodation & Food Services” and “Retail Trade”.
Figure 5 depicts the C&I loss rate by each participating firm under the severely adverse scenario. 13 out of 23 firms have loss rate higher than for the Dec-2020 exercise. The rest only have slightly lower loss rate than Dec-2020 except Barclays US that has significantly lower. The overall C&I loss rate is also higher than in Dec-2020.
So why are the projected C&I losses lower than Dec-2020? The reason is C&I balances in 2020Q4 (June-2021) were lower than in 2020Q2 (Dec-2020). Balances for C&I loans in the large banks peaked in May 2020 and have been constantly declining since then, currently to a level lower than pre-pandemic.

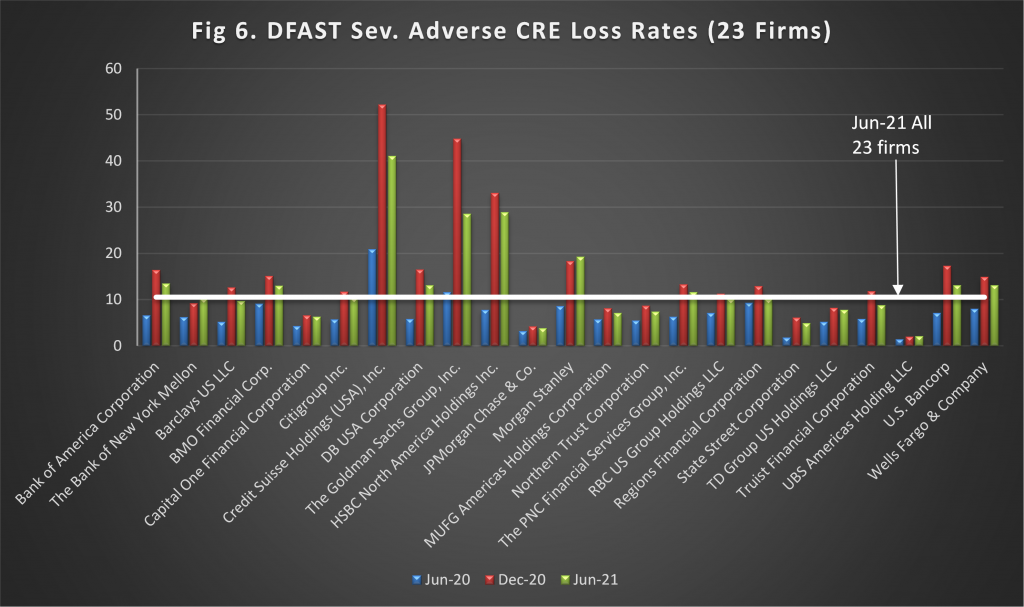
- The other big change relative to the previous results was for CRE. Although CRE losses are projected at $67B vs. $39B in June-2020, they are lower than the losses of $80B in Dec-2020. Figure 6 depicts the loss rate by firm in the last 3 rounds. It is worth noting that in June-2021 all firms except Morgan Stanley have a loss rate lower than Dec-2020. This is despite the fact that the June-2021 severely adverse scenario of the CRE index is much worse than the previous two severely adverse scenarios. Figure 7 depicts the three scenarios for the y/y growth of the CRE index. The June-2021 severely adverse scenario has a lower peak and a slower recovery than the previous two scenarios, and significantly lower than the Dec-2020 scenario in particular. CRE loan balances have remained relatively flat during this period.
So why are the projected June-2021 CRE losses lower than Dec-2020? It may be due to an adjustment applied by the Federal Reserve on the recovery rate of loans collateralized by hotel properties; see Box 1 on p.20 of the 2021 supervisory stress results report. In the Dec-2020 Stress Test, the Federal Reserve set a lower bound on the recovery rate for such loans to reflect “significantly lower collateral recovery rate than have been historically observed”. The Federal Reserve raised the lower bound in DFAST 2021, reflecting a stabilization in hotel property values in the second half of 2020.
Concluding remarks
- Three significant changes in this year’s results compared to the previous two, June-2020 and Dec-2020, are: (i) the reduction in projected losses for Credit Cards, (ii) C&I loans now having the highest losses of loan types amidst constant decline of their balances since May 2020, and (iii) CRE loans having losses higher than June-2020 but lower than Dec-2020 mostly due to an adjustment on the recovery rate for loans backed by hotel properties.
- Given the uncertainty surrounding certain CRE property classes due to the pandemic, i.e. hotel, retail and office, it would be very helpful if the supervisory stress test results included a breakdown of overall balances and projected overall losses by property type. This would further enhance the transparency of the stress test framework and would provide the industry with an invaluable risk benchmark.
- What do the above scenarios and results mean for regional and community banks? Community banks have three times concentration in CRE loans vs. all other banks. Thus, the above DFAST scenarios can form the basis for the stress test program in community banks. To create relevant stress scenarios, however, one would have to adapt the national scenarios to the geographical footprint and portfolio mix of the bank. This is a crucial step that we follow for our clients, given the asymmetry in the impact and recovery from the induced recession across geographies and asset classes.

Grigoris Karakoulas is the president and founder of InfoAgora (infoagora.com) that provides risk management consulting, predictive risk analytics, price optimization, scenario generation and CECL/stress testing solutions, and model validation services. Contact him at grigoris@infoagora.com.

