

The 2022 DFAST stress test results were released by the Federal Reserve Board (FRB) on June 23. In this article we first provide a summary of the results including a comparison with the 2021 exercise. We then drill into the results to analyze differences between company-run and FRB projections for loss rate and PPNR.
The 2022 DFAST results showed a larger decline by 30bps in the aggregate common equity tier 1 (CET1) capital ratio under the severely adverse scenario compared with last year’s stress tests. The slightly larger decline has been attributed to two reasons: (i) smaller initial allowances as conditions improved over the past year and (ii) higher adversity of the severely adverse scenario compared to last year.
Thus, although the aggregate and individual bank post-stress CET1 capital ratios remained well above the required minimum levels throughout the projection horizon, the results have translated into higher stress capital requirements for some of the biggest US banks.
For loans measured at amortized cost, their projected aggregate loss rate was 6.4%. This is slightly higher than the aggregate loss rate of 6.2%. Table 1 presents a comparison of the loss rate by loan type for the two years. It should be noted that 33 banks participated in the 2022 exercise, versus 23 in 2021.
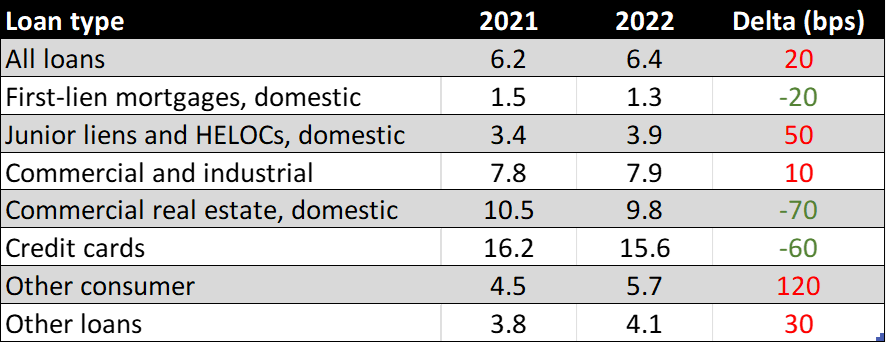
Table 1. Projected loan loss rate (%) by loan type
The small increase in the loss rate, both overall and for certain asset classes, was expected based on our initial analysis of the 2022 scenarios when the latter were released by FRB in February 2022. More specifically, “the above analysis indicates that the 2022 scenarios might lead to higher overall losses compared to the ones reported from the 2021 stress test. They would mainly be driven by an increase in losses from consumer, residential and C&I loans.”
As required by the Dodd-Frank Act, the participating banks had to provide company-run stress tests using the Supervisory Severely Adverse Scenario. In their DFAST disclosures the banks included a disclaimer for any differences between the company-run and FRB’s results, see for example the one in JP Morgan 2022 DFAST disclosure: “Because the models and methodologies utilized by the Firm and the Federal Reserve are different, the results separately published by the Federal Reserve may vary from those disclosed in this report.”
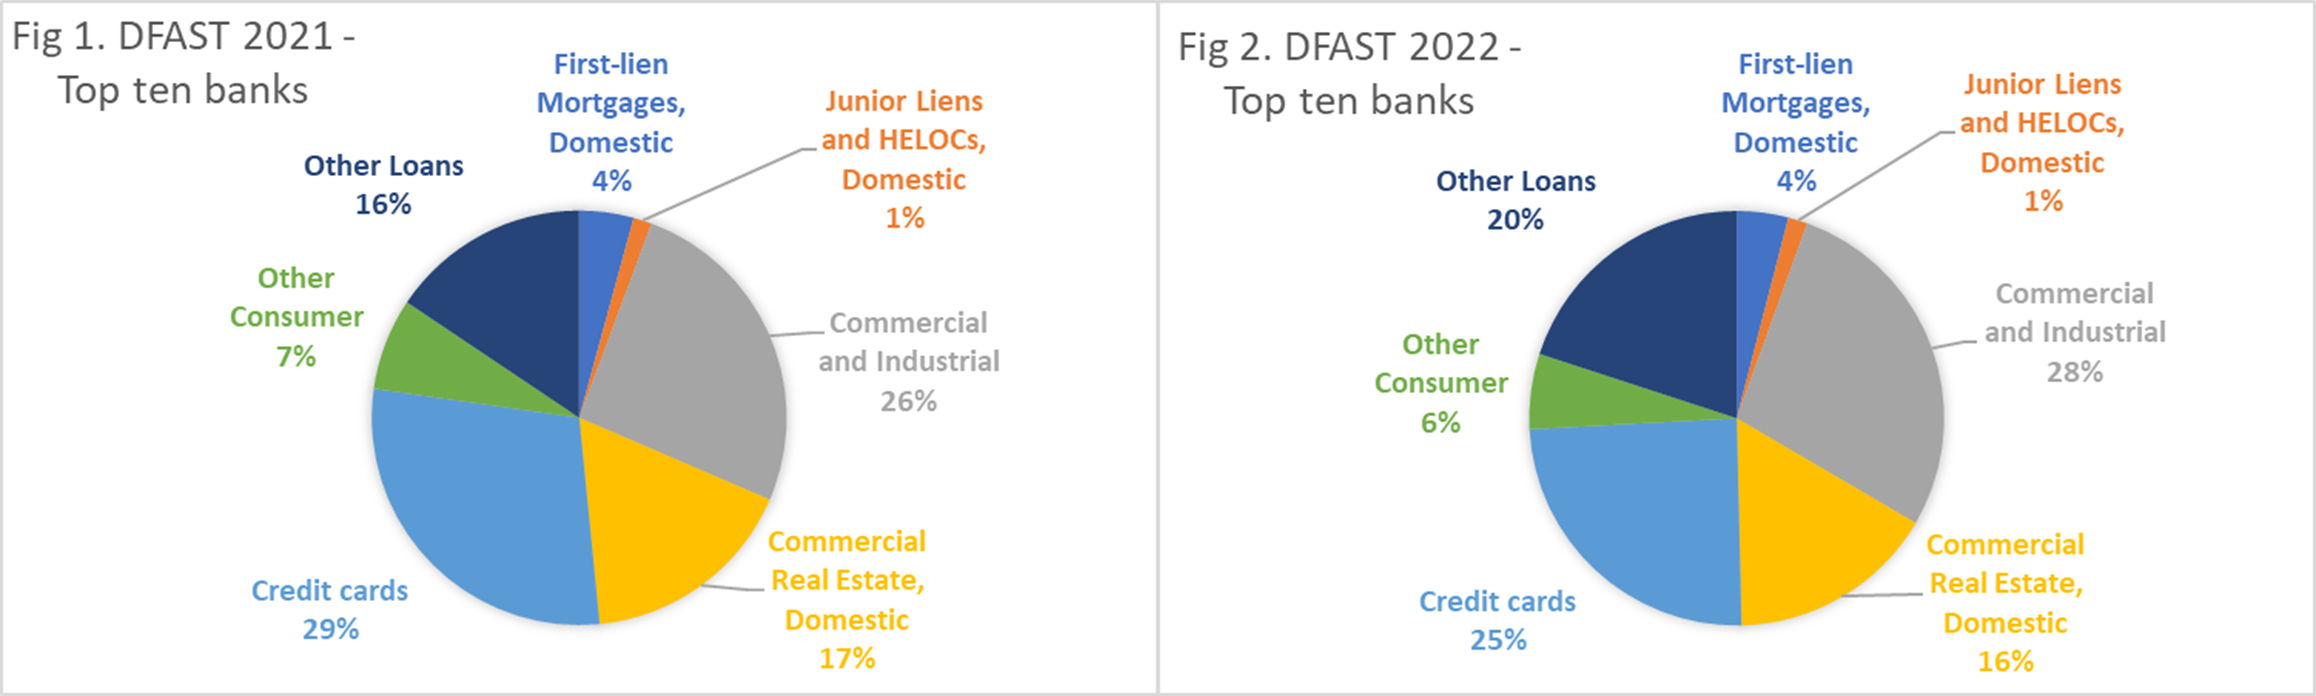
We wanted to analyze the differences between company-run and FRB’s stress tests looking for any systematic patterns in projected losses and PPNR. For this purpose, we focused on the disclosures of the largest 10 banks: JPMorgan, BofA, Wells Fargo, Citi, U.S. Bancorp, PNC, Truist, Goldman, TD Bank and Capital One.
Figures 1 and 2 depict the breakdown of losses of this group by loan type for 2021 and 2022 respectively. The projected losses for this group of banks seem to be consistent with what was observed for the whole group in Table 1 above.
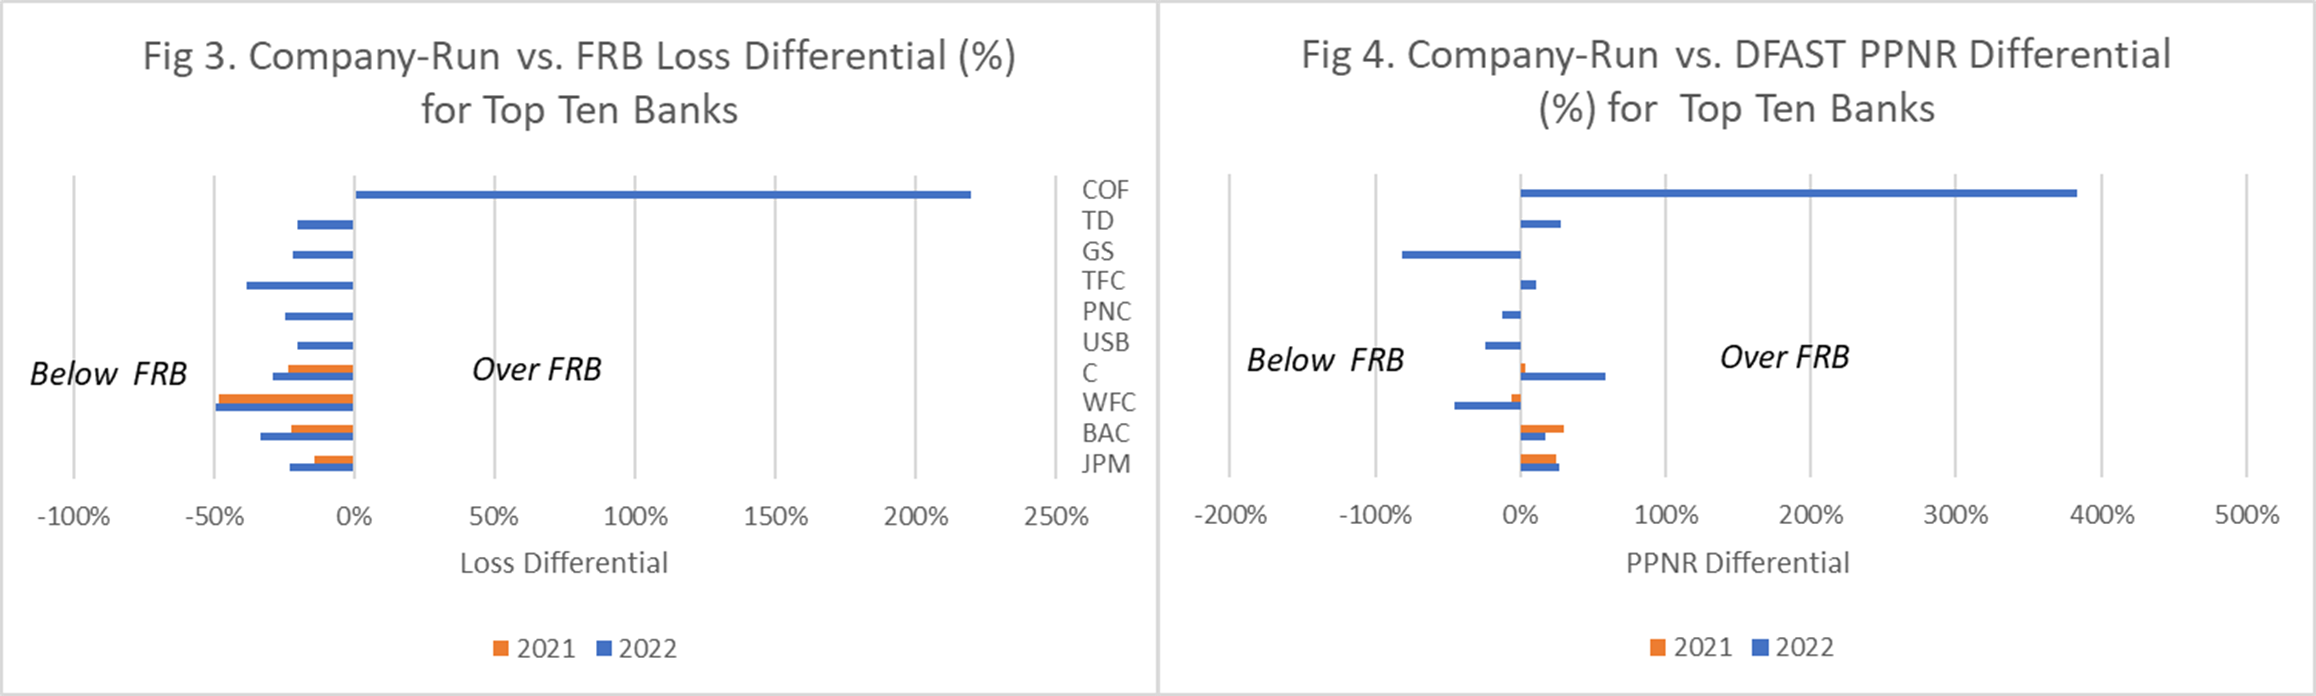
For each of the 10 banks we calculated the respective differential (rate of change) between the Company-run and FRB projected aggregate losses. We did this for 2022 and 2021. Only 4 of the top 10 banks released disclosures with company-run results for 2021 DFAST. Figure 3 depicts the results.
All but one of the banks have negative loss differential, namely the company-run projected losses being lower than the ones projected by FRB. In addition, for the 4 banks with 2021 DFAST disclosures the differential became more negative in 2022. The positive loss differential of Capital One is an outlier for this group. The magnitude of the differential also seems strange. Most of that differential is coming from the Credit Card asset class. Without this outlier the company-run projected losses are 29% lower on average, namely more optimistic, than FRB’s projected losses for this group.
Similarly, we calculated the PPNR differential between the Company-run and FRB projections. The comparison is presented in Figure 4. Once again, Capital One is an outlier with a very positive differential for PPNR, namely significantly higher PPNR than projected by FRB for this bank. This outlier pattern for the loss and PPNR differential requires further investigation of the underlying models and assumptions.
In contrast to the loss differential, there is less consistency in the sign of the PPNR differential across the group. The average PPNR differential for the group without the outlier is -2%. However, the average PPNR differential for the top 4 banks is about 14% for both years, namely more optimistic than projected by FRB.
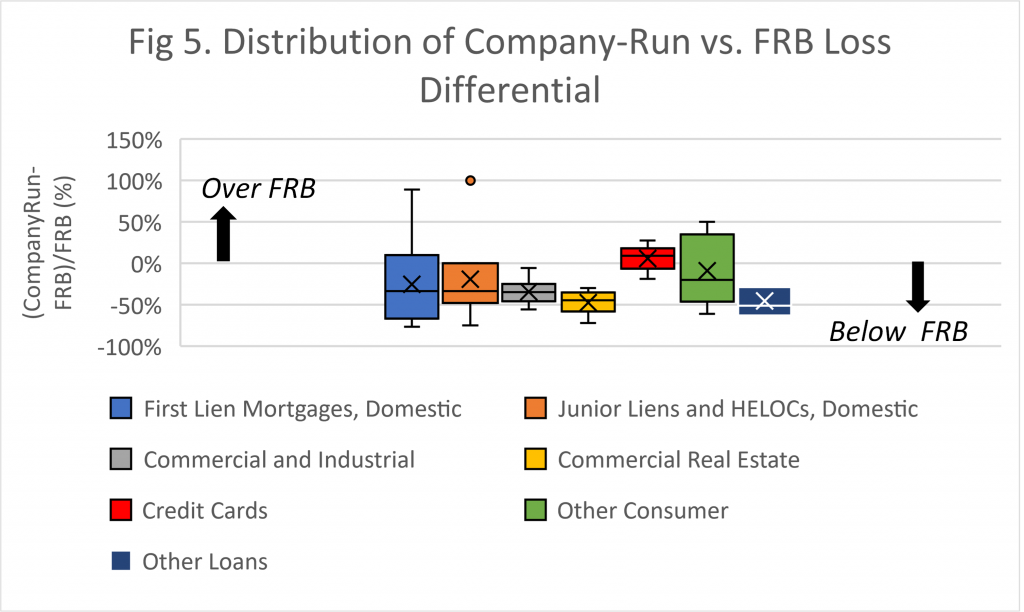
Are there any loan types that are particularly driving this optimism and underestimation in company-run projected losses? For each of the 9 banks in the group (excluding Capital One as an outlier) and their loan types we calculated the respective differential between the Company-run and FRB projected losses. The distribution by loan type is shown in the boxplot of Figure 5. Positive values denote company-run projected losses being higher than the ones from FRB and vice-versa. The average value per loan type is marked by “x”.
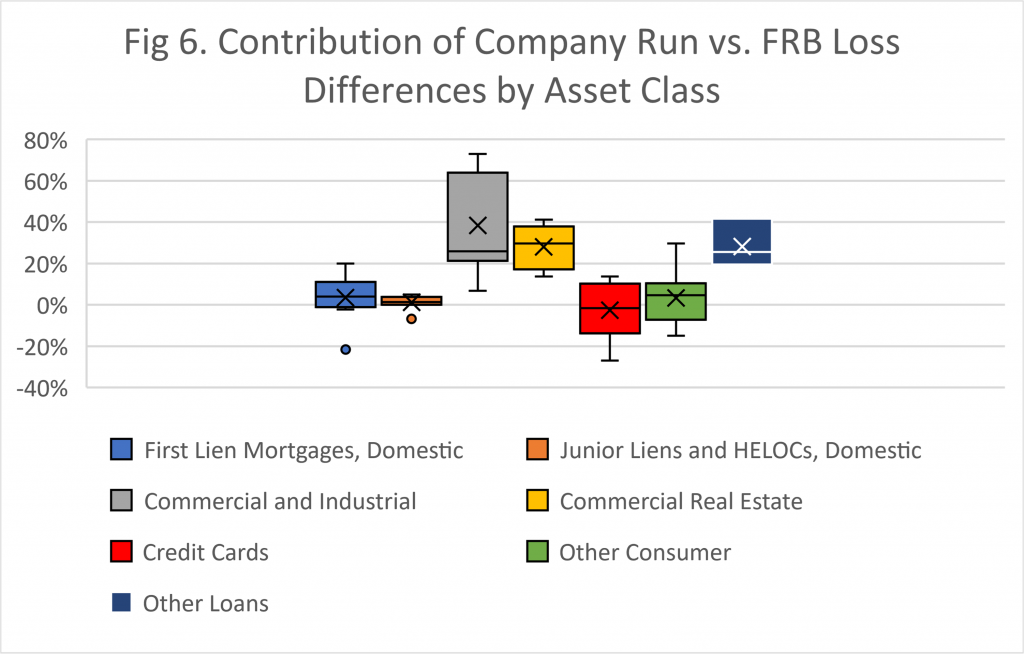
Almost all the loan types have negative loss differential. Furthermore, all the loss differential values for C&I, CRE and Other loans are negative. Indeed, Figure 6 shows that these three loan types are responsible for the negative loss differential that we observed, with C&I having the biggest contribution.
Concluding Remarks
- The small increase in the loss rate between 2022 DFAST and 2021 DFAST, both overall and for certain asset classes, is consistent with what we expected when we originally reviewed the 2022 scenarios back in February.
- As the models and methodologies utilized by the participating banks and FRB are different, one would expect differences between the company-run and FRB’s projections. However, our analysis of the top 10 banks has shown that these differences are not random.
- There seems to be a systematic underestimation of the losses compared to FRB’s projected losses. C&I, CRE and Other loans are the three main contributors to this underestimation.
- Although there is no clear pattern in the PPNR comparison for the group of 10 banks, there seems to be an overestimation of PPNR by the top 4 banks in the 2021 and 2022 DFAST exercises.
- The above findings together with flagging of one of the participating banks as an outlier require further investigation by the stakeholders of DFAST.