
On February 5, the Federal Reserve Board released the hypothetical scenarios for DFAST 20251. All scenarios run from the first quarter of 2025 through the first quarter of 2028. This year, the capital positions of 22 banks will be tested against the standard DFAST scenarios as part of CCAR.
As in last year’s DFAST, there is an accompanying exploratory analysis consisting of two separate “hypothetical elements”: (i) one with credit and liquidity shocks to nonbank financial institutions during a severe global recession as in the standard severely adverse scenario, and (ii) a market shock only applied to the eight largest banks. The results from the exploratory analysis will not affect capital requirements for the banks.
The market shock in (ii) purports to explore sudden dislocation to financial markets stemming from expectations of reduced global economic activity and higher inflation expectations. Recent economic data provide support for this type of hypothetical scenario. Under this shock, short-term Treasury security yields rise sharply, while long-term yields increase to a lesser extent. This contrasts with the drop in short-term yields under the severely adverse scenario. An increase in anticipated defaults leads to a widening in credit spreads as well.
I have been a strong proponent of integrated stress testing that simultaneously forecasts risks on both sides of the balance sheet, not just credit risk. Although the exploratory analysis is only meant for the eight largest banks, I would recommend the market shock of the exploratory analysis be adopted by regional and community banks regardless of their size for their stress testing.
- How would such shock in the financial markets affect real estate prices, or various industries within the specific geographies a regional or community bank lends to2?
- How would a regional or community bank develop relevant scenarios for its stress testing using the regulatory scenarios?
The standard scenarios of DFAST 2025 are reviewed next by focusing on key macroeconomic factors and addressing two questions:
- How does the 2025 severely adverse scenario compare with the 2024 severely adverse scenario?
- What do any differences imply for potential impact on the banks’ losses relative to last year’s test?
Figures 1-6 depict the standard scenarios of DFAST for the following six macroeconomic factors:
- Real GDP in Figure 1
- Unemployment rate in Figure 2
- House price index (HPI) y/y change in Figure 3
- CRE Price Index y/y change in Figure 4
- BBB spread in Figure 5 and
- Stock market index q/q change in Figure 6
The 2024 severely adverse scenario is included as a dashed orange line in each of the above figures. The quarter of the trough/peak in the severely adverse scenario of each macroeconomic factor is also denoted.
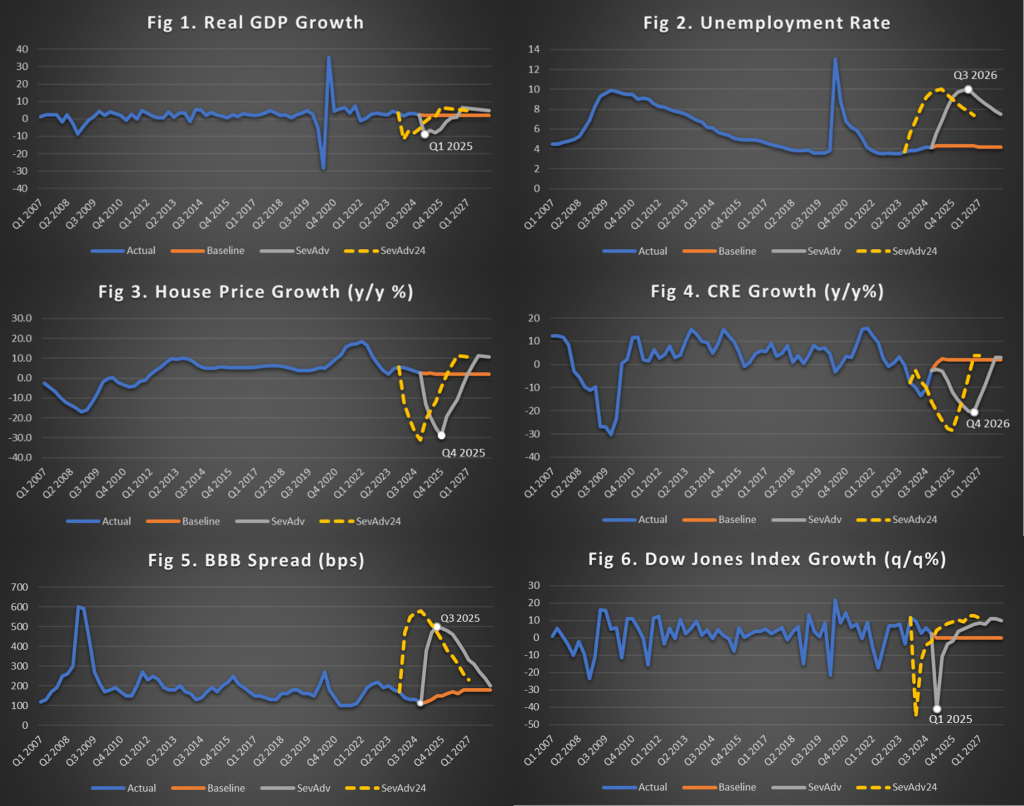
- Unemployment Rate in the 2025 scenario peaks in Q3 2026 at the same peak level as in 2024. Thus, this also implies a neutral effect on losses compared to 2024.
- Similarly, House Price Growth (y/y) in the 2025 scenario bottoms in Q4 2025, at a value slightly lower than the 2024 scenario but still lower than the trough of the Great Recession. This implies a neutral to negative effect (decrease) on losses for residential mortgages relative to 2024.
- CRE price index y/y change in the 2025 scenario exhibits a recession trajectory similar to 2024, but with a smaller trough. It bottoms in Q4 2026 at -20.5% vs. -28.6% for the 2024 scenario. The Fed justifies the smaller price decline because of the realized price declines in the last 4 quarters. In the 2024 results, 11% of the projected losses under the severely adverse scenario were from CRE loans with a portfolio loss rate of 8.8%. We would therefore expect a lower loss rate and share for CRE loans in 2025 compared to 2024.
- BBB spread has a similar trajectory to the 2024 scenario. It peaks in Q3 2025 but at a lower level, 500bps vs. 580bps in the 2024 scenario. Of course, the widening of the spreads starts from a slightly lower level in the 2025 scenario than in 2024, 110 in Q4 2024 vs. 170 in Q4 2023. In the 2024 results, 21% of the projected losses under the severely adverse scenario were from C&I loans with a portfolio loss rate of 8.1%. Thus, we would expect a lower loss rate and share for C&I loans in 2025 compared to 2024.
- At the same time, the DJ stock market return bottoms in Q1 2025 at a level higher than the 2024 scenario, i.e., -40.9% vs. -45.3%. Trading and counterparty losses accounted for 13% of projected losses in 2024. We would expect a lower loss share in 2025.
Given the smaller drop in CRE prices and lower peak in BBB spread in the 2025 severely adverse scenario compared to 2024, we would expect lower losses for CRE and C&I loans. Since the remaining key economic factors have very similar paths relative to last year, we would also expect lower overall losses to be projected this year.
Concluding Remarks
The above comparative analysis indicates that the DFAST 2024 severely adverse scenario would lead to lower overall loss forecasts compared to the ones reported from the 2024 stress test.
The stress in the CRE price index is an average across CRE asset classes. However, the rising noncurrent ratio for CRE is currently driven by Office and Multifamily. For this reason, the Federal Reserve states in its scenario guidelines: Declines in commercial real estate prices should be assumed to be concentrated in properties most at risk of a sustained drop in income and asset values.1
What happens if a bank, for example, has higher concentration in CRE Office, Multifamily and/or in urban centers that have been hit more by the changes in consumer behavior? In such cases, as previously argued2,3, a bank should use scenarios for more granular CRE indices by asset class and geography for better accuracy in its loss forecasts and impact on capital. Of course, such granular scenarios should be conditional on the DFAST severely adverse scenario of the aggregate CRE index for consistency.
Similarly, what if a bank, for example, has significant exposures in manufacturing, oil & gas or agriculture? For its stress test program, the bank should use granular scenarios by industry and geography and for commodities that are consistent with the DFAST severely adverse scenario.
CRE loans account for a substantial portion of bank assets, about a quarter of assets for an average bank. Regional and community banks are particularly vulnerable as they are almost five times more risk exposed to the sector than larger banks. Almost $309 billion of office loans is expected to mature by the end of 2025. What would happen to the renewal default risk of these loans under higher rates? What would happen if half of the uninsured deposits left the bank as it had to deal with significant losses in its CRE portfolio?
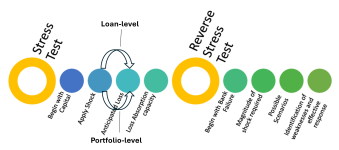
Whether for loan level (bottom-up) or portfolio/bank level (top-down) stress testing, banks need relevant scenarios for integrated stress testing. A bank should also explore additional shocks such as the market shock of the exploratory analysis by adapting them to its geographical footprint and balance sheet mix. This would enable the banks to stress beyond just credit risk for integrated stress testing.
This scenario customization is a crucial step that we follow for our bank clients according to their balance sheet composition and geography.
References
- Federal Reserve Board – Federal Reserve Board releases the hypothetical scenarios for its annual stress test
- Karakoulas G., How Company-Run and Fed DFAST Projections Measure Up. RMA Journal, October 2023, pp.15-18.
- 2023 Stress Testing Scenarios | InfoAgora
Grigoris Karakoulas is the president and founder of InfoAgora (infoagora.com) that provides predictive (ML) risk analytics, price optimization, scenario generation and CECL/integrated stress testing solutions, and model validation services. Contact him at grigoris@infoagora.com