As the Paycheck Protection Program Flexibility Act has just been signed and the loan forgiveness process of the program is about to start, the ADP national employment report for May 2020, that came out on June 3rd, and the May Employment Report from the Bureau of Labor Statistics, that came out on June 5th, shed new light on the effectiveness of the program.
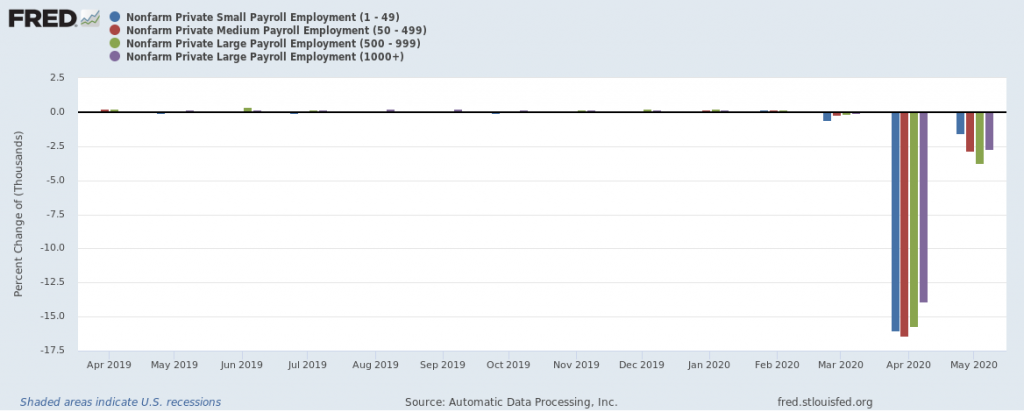
Using the ADP report, Figure 1 shows the monthly percentage change in job losses by business size over the last 12 months. Job losses in May dropped from April across the four business size segments, as state have started reopening their economies. However, small businesses with less than 500 employees (blue and red bars) had a bigger monthly drop in job losses in May than businesses with more than 500 employees. In particular, the 1-49 employee segment had the biggest monthly drop by 14.5 percentage points.
Thus, despite the shortcomings in the distribution of the PPP fund analyzed in our previous article, this difference in job losses by business size could be due to PPP since the program has targeted small businesses with up to 500 employees.

Figure 1. Monthly change in Private Nonfarm jobs by Business Size
Which industries have exhibited the biggest drop in job losses?
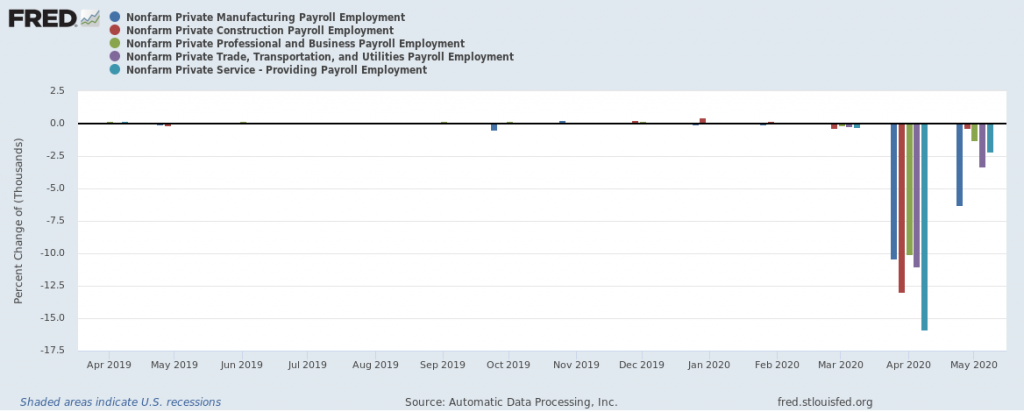
Figure 2 depicts the monthly change in jobs for five industry segments over the last 12 months. The Service segment experienced the biggest drop by 13.75 percentage points. The Construction segment experienced the second biggest drop by 12.6 percentage points, with hardly any job losses in May. These two segments have ranked in the top five industries of the PPP fund distribution as of May 30, please see Table 1 below. Construction was the top industry in the first phase of the PPP distribution.
It is worth noting that although Manufacturing has ranked fourth in the fund distribution just below Construction, its job losses have not yet shown a similar significant impact.

Table 1. Top Five Industries in PPP fund distribution (May 30)
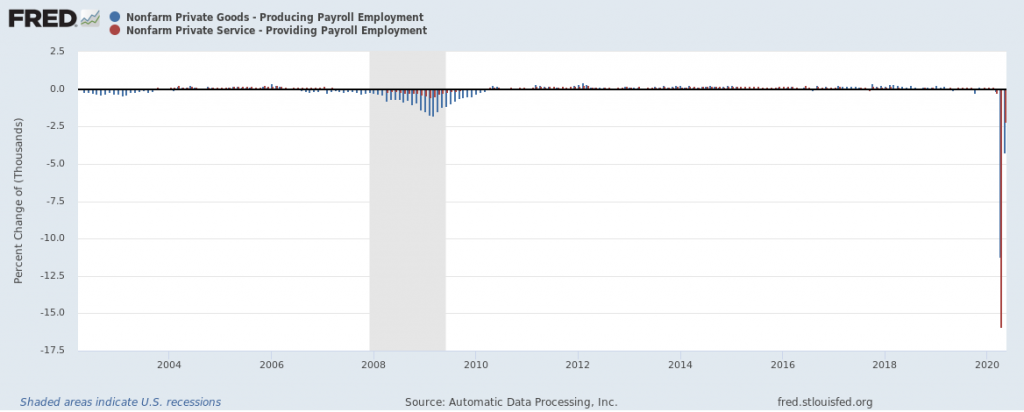
Figure 3 compares the monthly change in jobs for the two segments of Goods-producing and Service-providing since 2002. It includes the Great Recession for two reasons: (i) the relative magnitude of the job losses experienced currently and (ii) Service-providing businesses suffered far more job losses than the Goods-producing businesses in this recession than the Great Recession. As commented above, Service-providing businesses seem to be recovering much faster than Goods-producing businesses based on employment.
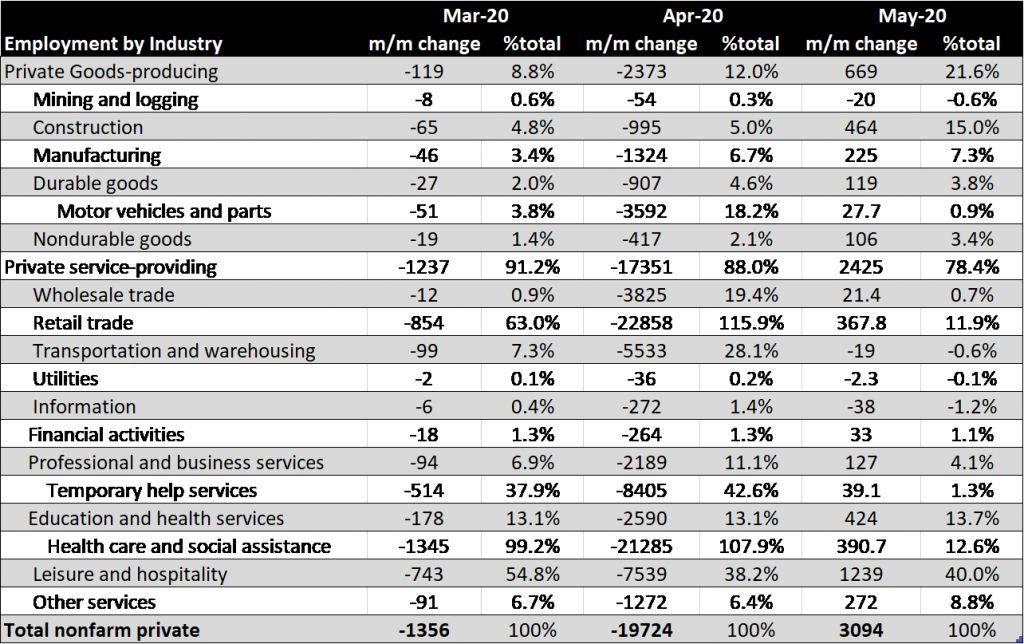
Table 2 presents the employment by industry from the establishment survey data of the Bureau of Labor as reported on June 5. The report identified the same patterns for the change in employment between April and May, although the numbers for both months are preliminary. Thus, out of the just over 3 million jobs created in nonfarm private businesses in May, 78% were in Service-providing and 22% in Goods-producing. Furthermore, Leisure and Hospitality (40%), Construction (15%) and Education & Health (14%) were the top three industries for employment. Construction, in particular, gained back almost half of April’s job losses.
- Taking advantage of the PPP program, businesses have been exhibiting different speeds of recovery depending on size and industry. Such differences combined with regional ones should be taken into account when developing macroeconomic scenarios for business planning, loss reserving and capital planning.

Figure 2. Monthly change in Private Nonfarm jobs by Industry

Figure 3. Monthly change in Private Nonfarm jobs for Goods-Producing vs. Service-Providing

Table 2. Employment by Industry – Bureau of Labor Statistics
Grigoris Karakoulas is the president and founder of InfoAgora (infoagora.com) that provides risk management consulting, predictive risk analytics, price optimization, scenario generation and CECL/stress testing solutions, and model validation services. Contact him at grigoris@infoagora.com

