In a recent LinkedIn post we highlighted the risk of repricing for real estate assets due to rising interest rates and inflation. The latter will also negatively impact industries that carry high inventories. In addition, there is generally a positive relationship between the rise of interest rates and serious delinquencies.
As inflation at 6.8% has reached its highest level in almost 40 years, financial institutions should perform scenario analysis to assess the vulnerabilities of their portfolios to inflation and rising interest rates.
To help in developing such scenarios, we examine
- the outlook on inflation and rising interest rates,
- the statistical relationship between inflation and cost of shelter to look for persistent patterns, and
- the variability of inflation by location
Figure 1 shows an excerpt from the BofA Global Fund Manager Monthly Survey on the question: What do you consider the biggest ‘tail risk’. Hawkish central bank rate hikes now constitute the biggest ‘tail risk’ overtaking Inflation, which ranked at the top in last month’s survey.
Fig 1. BofA Global Fund Manager Survey: What do you consider the biggest ‘tail risk’

Figure 2 depicts the spread of 10yr Treasury yield and CPI. The spread just hit a record low at -5.32%. At the previous two times it reached such negative levels, mid ‘70s and early ‘80s, the spread turned positive within a period of 5-9 months from its bottom. The speed of this spread turning positive will depend on how hawkish the Fed will be on hiking interest rates and how fast inflation will drop.
Fig 2. 10yr Treasury yield – CPI y/y

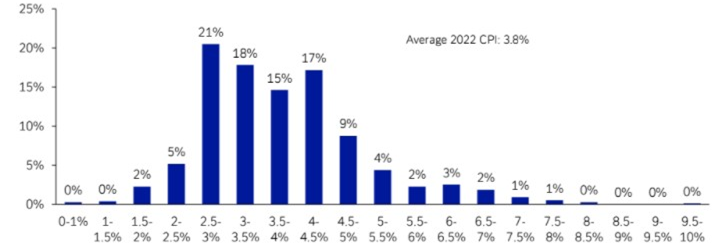
- What is the outlook for inflation? According to a survey conducted by Deutsche Bank Research during December 6-9 2021 with over 750 responses, inflation at the end of 2022 will be on average at 3.8% as shown in Figure 3. Similarly, Bloomberg Consensus CPI forecast for 2022 is at 3.75%. Both forecasts are well above Fed’s target for 2022 at 2.6% (as of Dec 15, 2021).
Fig 3. Deutsche Bank Research Survey: Current US CPI is 6.2% YoY, what will be at end 2022?

The effect on CPI inflation from the price increases of bottleneck-affected items in recent months has been well documented in the literature. As supply chain disruptions are restored and supply/demand get adjusted, these effects should ease.
On the other hand, Rent and Owners’ Equivalent Rent (OER)—the amount of rent equivalent to the cost of ownership—are among the most important components of the Consumer Price Index (CPI) and the personal consumption expenditures (PCE) price index. Thus, Shelter makes up nearly a third of the basket for CPI inflation.
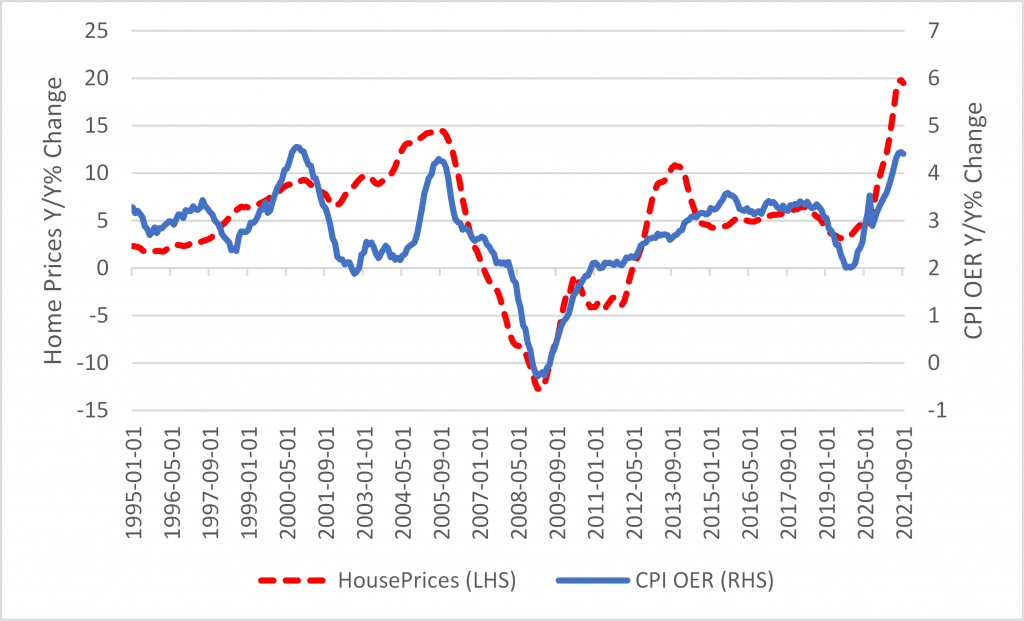
There is a strong correlation between current OER inflation and future house price growth. In fact, house price growth is most strongly correlated with OER inflation 16 months later.
Figure 4 depicts the two series with OER lagged by 16 months. Based on the relationship of OER with house prices and given the jump in house prices since the pandemic, OER is expected to significantly rise further and therefore increase inflation by about 0.7% at the end of 2022 relative to the pre-pandemic inflation level of 1.8%.
- Even if all the price increases of bottleneck-affected items ease, OER inflation by itself may bring inflation above the Fed’s target at the end of 2022.
Fig 4. CPI Onwers’ Equivalent Rent (16-month lag) vs. S&P Case-Shiller House Prices (Y/Y %)

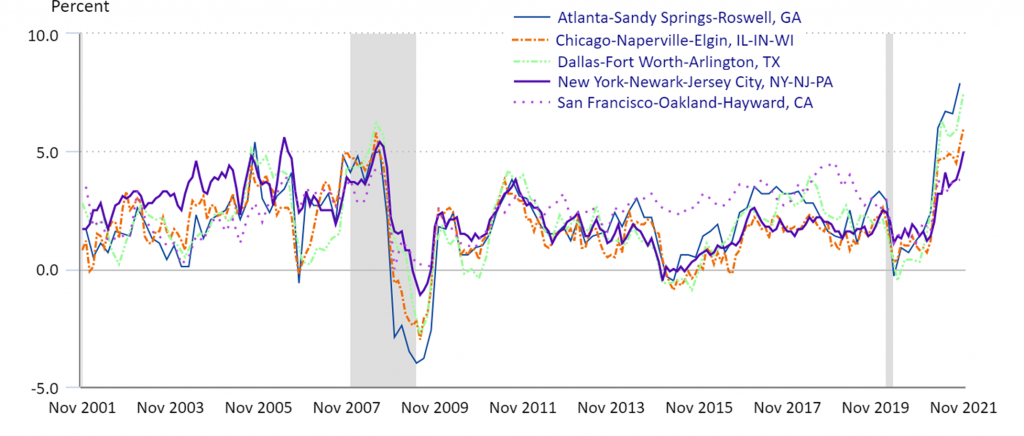
CPI, like other macroeconomic factors, has exhibited more asymmetry since the pandemic. Figure 5 depicts CPI y/y, all items and not seasonally adjusted, for five MSAs. It is worth pointing out the significant variability of CPI by MSA: From 3.8% for San Francisco CA to 7.9% for Atlanta GA. Although San Francisco used to have the highest inflation in the group, it has had the lowest since the pandemic.
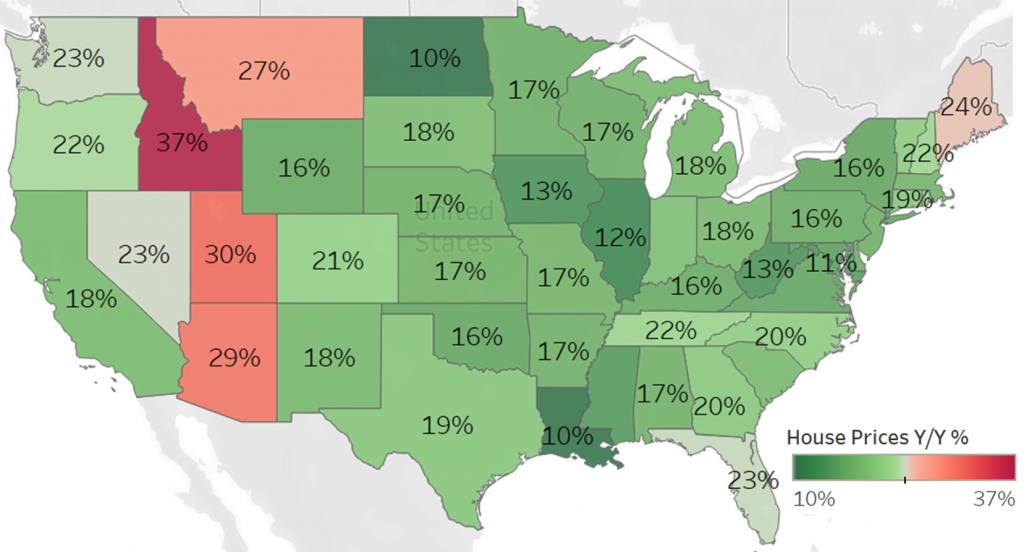
Furthermore, we expect this asymmetry in the evolution of CPI to continue in 2022 and 2023, given the asymmetry in rent and house price growth shown in Figures 6 and 7. These are two factors that are affecting CPI as discussed.
Hence, based on the above we recommend that:
- financial institutions analyze the vulnerabilities of their portfolios from inflation and rising interest rates over at least a two-year horizon, and
- take into account the dynamics of inflation in their geographical footprint instead of nationally.
Fig 5. CPI, all items (NSA) y/y by MSA

Fig 6. Y/Y Rent Change by State, October 2021

Fig 7. Y/Y House Price Change by State, Q3 2021

Grigoris Karakoulas is the president and founder of InfoAgora (infoagora.com) that provides risk management consulting, predictive risk analytics, price optimization, scenario generation and CECL/stress testing solutions, and model validation services. Contact him at grigoris@infoagora.com

