
Several large U.S. banks have been reporting 1Q2022 earnings in the last two weeks. What are some of the key themes from these reports, and what could they imply for smaller banks?
- Net interest income growth was better than expected for most banks due to stronger than expected NIM and loan growth led by C&I loans
- Fee revenue growth was weaker than expected primarily attributed to weakness in the mortgage and investment banking businesses
- Credit and debit card usage trends were positive y/y, and growth in credit card balances has picked up
- Operating expense growth was mixed depending upon the business mix of the bank
- Increases in the negative AOCI (Accumulated Other Comprehensive Income) levels
- Credit quality continues to be strong for all banks, with nonperforming assets and net charge-off ratios at exceptionally low levels
- Outlook for credit quality diverged, with domestic focused banks releasing loan loss reserves whereas global banks adding to their reserves citing increased risks associated with inflation, possibly slower economic growth due to the Fed’s monetary and quantitative tightening, and geopolitical risks.
Are these emerging themes expected to persist in subsequent quarters? How are they affected by elevated inflation, rising interest rates and overall uncertainty in the macroeconomy? What could these themes imply for the smaller banks and banking industry?
Rising Inflation and Wages
Although wages have been rising, particularly in industries with unmet labor demand, they have not been rising as fast as inflation. Thus, the highest inflation in decades and lack of fiscal stimulus have caused a drop in Real Disposable Personal Income as shown in Figure 1. Its annual rate has dropped below its pre-pandemic trendline since September 2021.
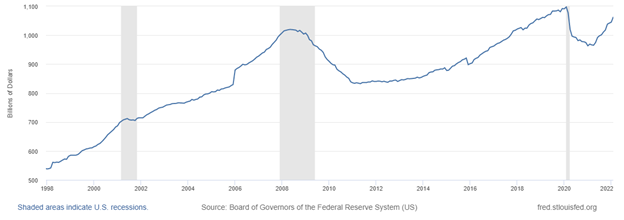
This has led to a consistent growth in Total Consumer Credit and specifically Revolving Credit (owned and secured) since that time, as shown in Figures 2 and 3 respectively.
Hence, it is no surprise that the large banks have reported strong growth in consumer spending and credit card balances. This trend is expected to continue in the coming quarters as the pandemic-era excess savings dwindle.
Fig 1. Real Disposable Personal Income
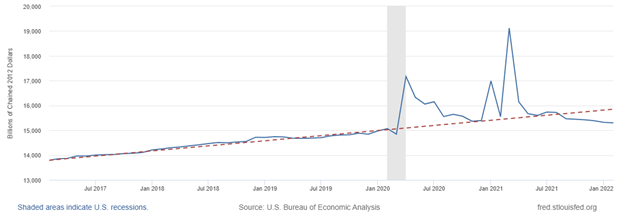
Fig 2. Total Consumer Credit (G.19 Consumer Credit, Federal Reserve System)
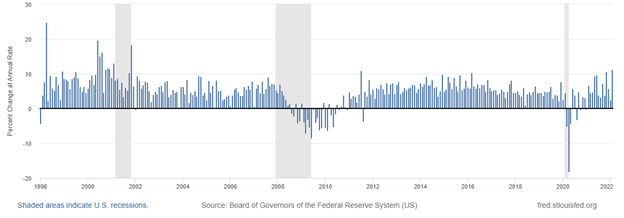
Fig 3. Revolving Consumer Credit (G.19 Consumer Credit, Federal Reserve System)
Rising Interest Rates
When the closely watched spread between the 10-year and 2-year Treasury notes turned slightly negative few weeks ago, warning flares were sent up by Wall Street analysts and economists. This is because the so-called “inverted yield curve” has preceded all recessions since the ‘80s as shown in Figure 4.
However, since Fed governor Lael Brainard’s remarks on faster shrinking of the Fed’s asset portfolio the yield on the 10-year note jumped much higher than the 2-year turning the spread positive. This rapid shift due to expectations of faster quantitative tightening from the Fed may have diminished the significance of this spread as a recession indicator this time around.
In fact, another measure of the slope of the yield curve has been quoted in the literature as a leading indicator of recessions, the yield spread of 10 Year minus 3 Month Treasury also depicted in Figure 4, has been widening rather than narrowing. This measure of the slope has inverted before every recession since the mid-1950s.
At the same time, the Fed has already increased the federal funds rate by 25bps and its governors have signaled for aggressive tightening in the coming months.
What do the aforementioned shifts in the yield curve and changes of its slope mean for banks’ balance sheets and profitability?
Fig 4. Treasury Yield Curve Slopes

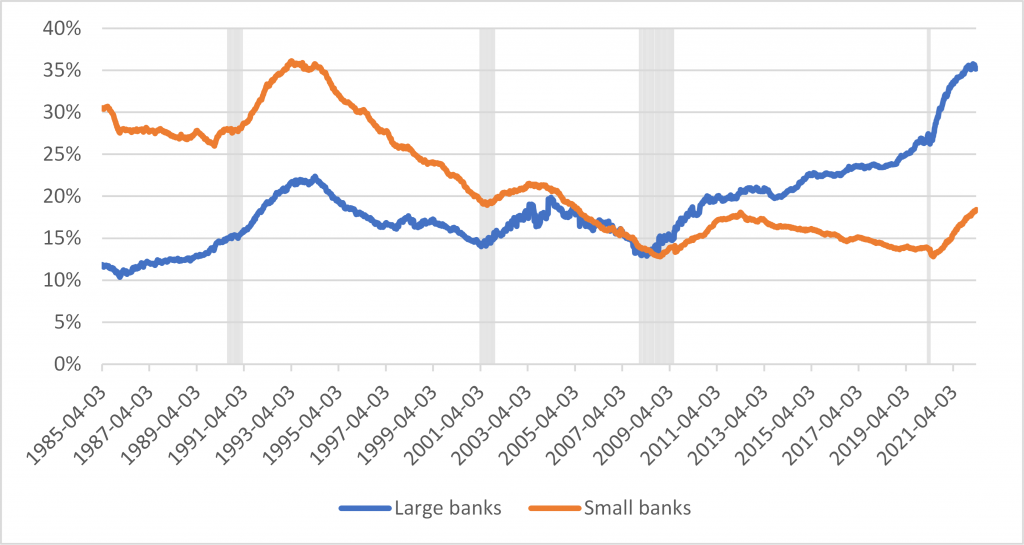
Banks have binged on Treasury bonds in the last two years due to the massive increase in deposits and relatively low demand in credit. Figure 5 depicts the share of Treasury securities in bank credit for U.S. Domestically Chartered Large (top 25 banks in assets) and Small Banks (H.8 report, Federal Reserve System).
For Large Banks the share had been slowly rising since the Great Financial Recession up until before the pandemic. It jumped by 10 percentage points in the last two years, and it seems to have recently peaked at over 35% of bank credit, a record level for this group of banks.
The share of Treasury securities in Small Banks used to be in decline since its record level of 35% in the mid-‘90s. It sharply reversed course in the last two years and has risen by 5 percentage points to 17% (half of the share at Large Banks) with no signs of peaking yet.
Fig 5. Treasury Securities in Bank Credit: U.S. Banks
In general, rising rates tend to bolster banks’ lending profitability. This is the reason large banks have reported NIM growth in 1Q22. This is positive news for community banks, as they mainly rely on NIMs to maintain their profitability.
However, rising long-term interest rates will lead to unrealized losses in banks’ fixed income portfolio resulting in higher negative AOCI levels. The latter will impact tangible common equity. This is consistent with what was reported by large banks for 1Q22. We expect a similar impact for smaller banks, albeit at a smaller scale due to the smaller share of Treasury securities in their credit portfolios. Of course, banks with the highest levels of liquidity as a percentage of average earning assets will be less vulnerable to these market-to-market issues as their portfolio durations are relatively short.
Growth in Loans & Leases
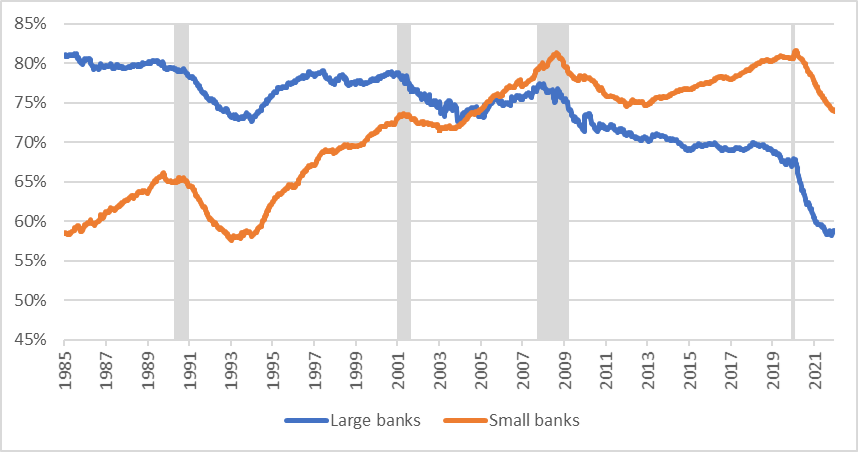
Figure 6 shows the share of Loans & Leases in bank credit for Large and Small Banks. The share has been in decline since pre-pandemic for both groups, although it seems to have recently stabilized for Large Banks. Furthermore, the share in Small Banks is at 15 percentage points higher than in Large Banks (74% vs. 59%) reflecting the lower share of Treasury securities in their bank credit.
Loans & Leases in Large Banks grew by 0.6% during Q1 and by 0.5% in Small Banks.
- Which asset classes drove this growth?
Fig 6. Loans & Leases in Bank Credit of U.S. Banks
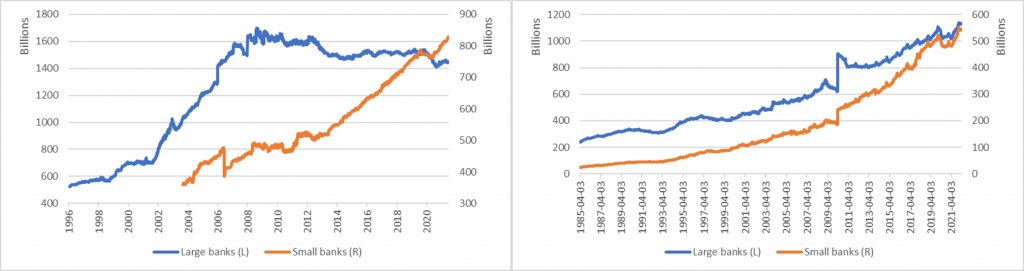
Figures 7-10 depict the time-series of balances for C&I, CRE, Residential Real Estate (RRE) and Consumer loans (H.8 report, Federal Reserve System).
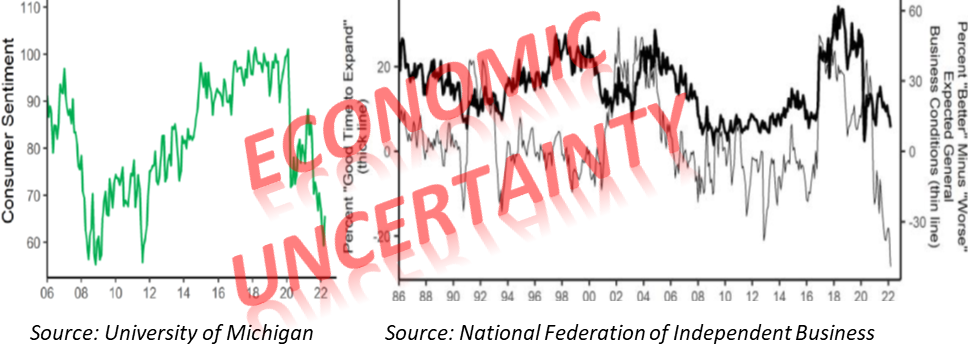
- C&I loan balances for both groups of banks are currently at levels much lower than their PPP-related peaks. They have started rising again for Large Banks and have stabilized at a lower level for Small Banks. The decline in C&I at Small Banks could be partly explained by the negative small business outlook from the National Federation of Independent Business (see right graph on the cover chart).
- CRE loan balances in Small Banks have been in constant growth over the last 10 years. The pandemic-induced recession did not affect that growth. We expect this growth to continue in the coming quarters. CRE loan balances in Large Banks have stayed flat over the last 3 years at a record high.
- The constant growth in RRE loan balances of Small Banks took a pause because of the pandemic and has resumed since Q1 2021. In contrast, RRE loan balances in Large Banks seem to have plateaued at a level lower than pre-pandemic. We expect RRE loan growth to slow down due to further deterioration in housing affordability from rising mortgage rates and home prices.
- Consumer loan balances were negatively affected by the pandemic-induced recession at both Large and Small Banks. Since Q1 2021 balances have resumed their growth in both groups and are currently at levels higher than pre-pandemic. We expect this trend to continue despite Consumer Sentiment being at relatively low levels (see left U. of Michigan graph on the cover chart).
It is worth noting that RRE loans form the biggest share of Loans & Leases at Large Banks, at 24.7%, followed by C&I loans and Consumer loans, at 22.8% and 19.4% respectively.
For Small Banks, CRE loans form the biggest share at 40.8%, followed by RRE loans and C&I loans, at 19.8% and 18.8% respectively.
Hence, the rising interest rates and the growing balances of C&I and Consumer loans in Large Banks, and of CRE, RRE and Consumer loans in Small Banks bode well for increase in earnings for both groups.
Fig 7. C&I Loans in U.S. Banks Fig 8. CRE Loans in U.S. Banks
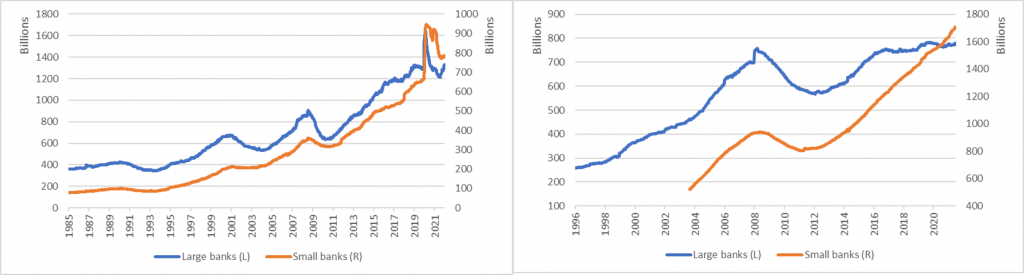
Fig 9. Residential Real Estate Loans Fig 10. Consumer Loans in U.S. Banks
Outlook for Credit Quality
Figure 11 depicts the allowance-to-loan ratio for the two groups of U.S. banks. The ratio for the two groups is at about 160bps, much lower than the respective pandemic highs but higher than the pre-pandemic levels of about 120bps. Will the ratio continue its decline for the two groups?
As mentioned, there seems to be a divergence in outlook for credit quality amongst large banks in 1Q22 with few of the large banks building on reserves to account for the rising economic uncertainty. We expect this divergence to carry over to smaller banks in the coming quarters, particularly as community banks adopt CECL by yearend. The divergence will be impacted by differences in asset mix (e.g. our recent blog on stresses on CRE Office) and regional economic outlook.
For example, Figure 12 shows how significantly CPI varies across MSAs. CPI in Atlanta, GA and Phoenix, AZ in February, at 10.6% and 10.9% respectively, was more than double the inflation in San Francisco, CA at 5.2%. It was 7.9% nationally.
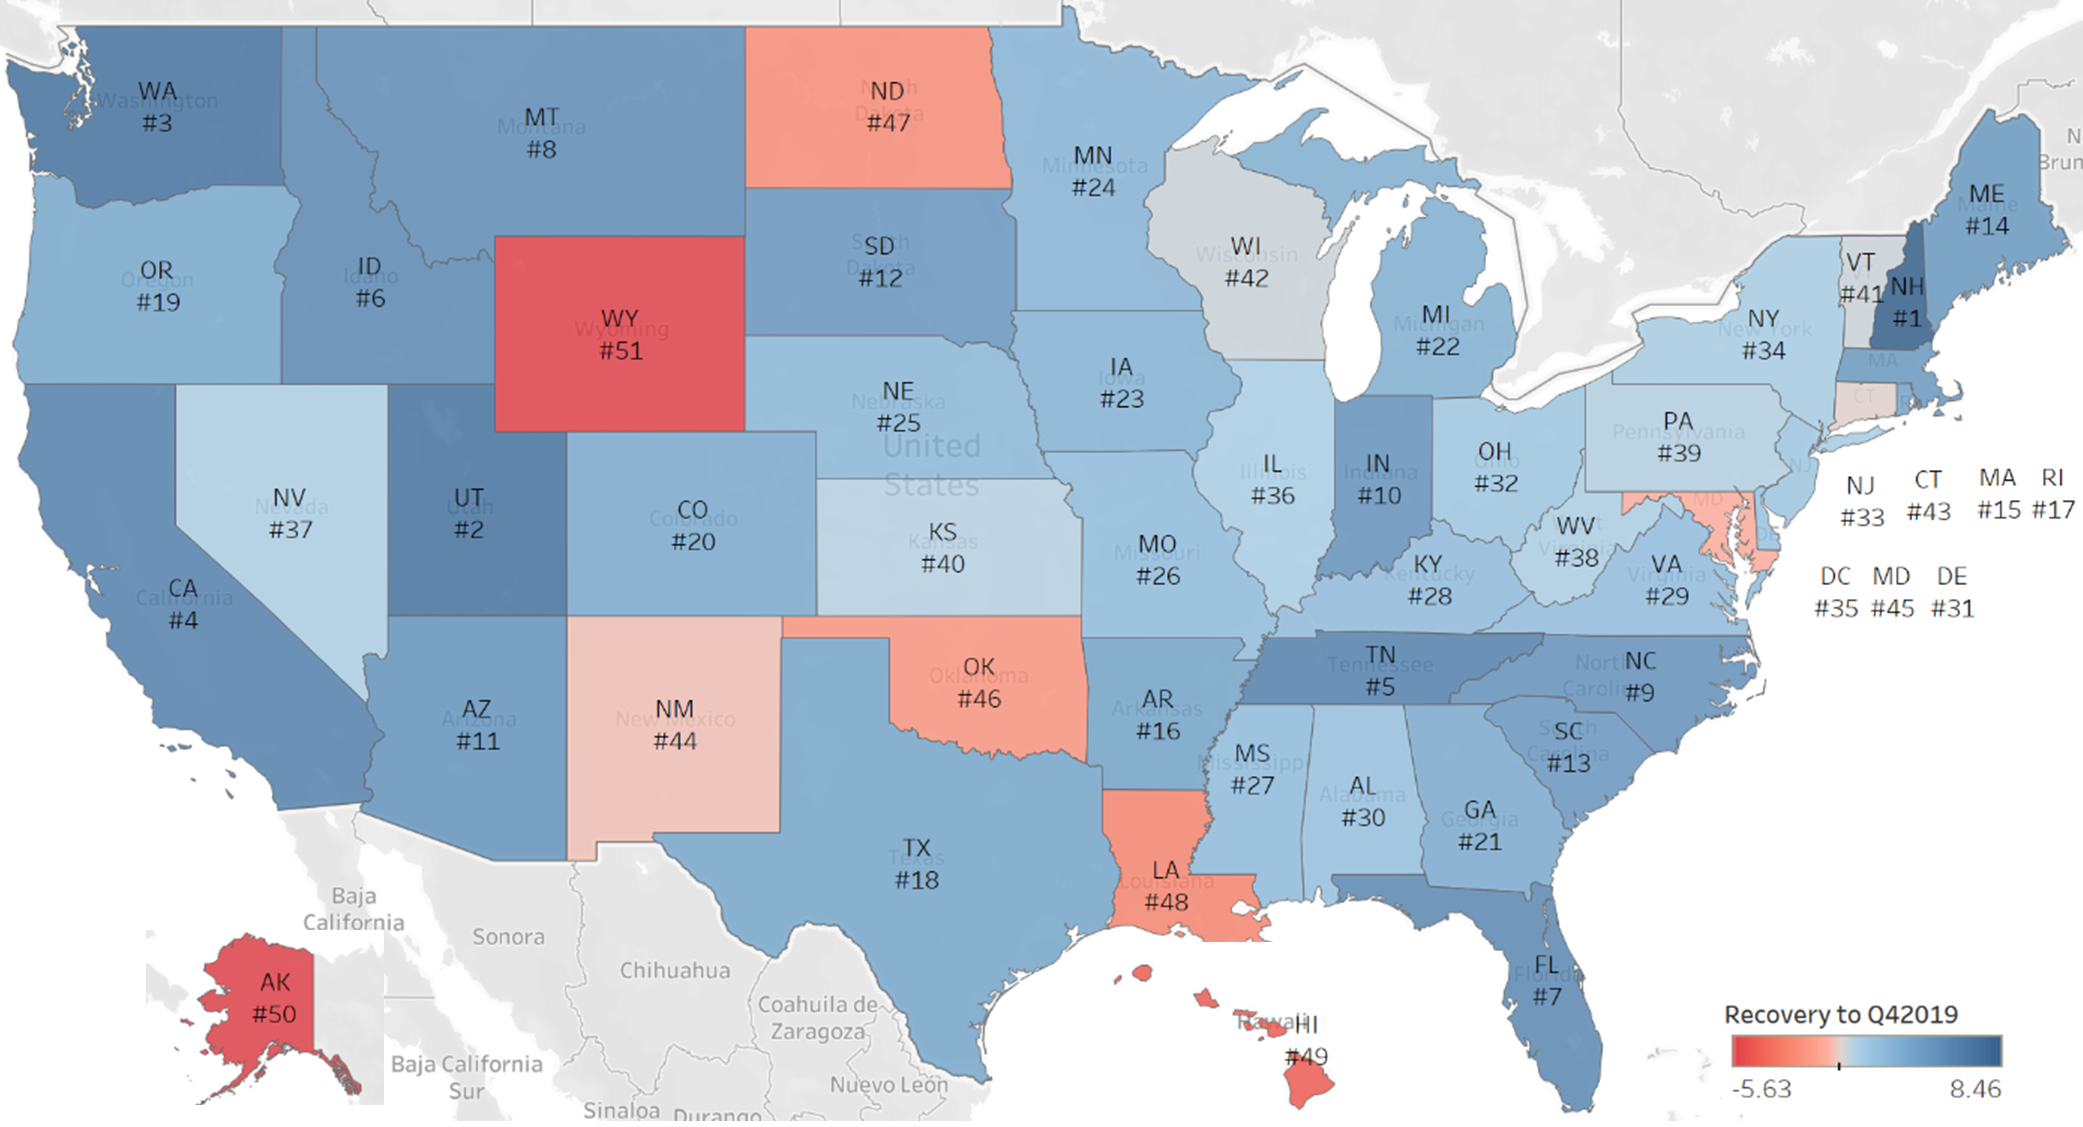
Figure 13 depicts the recovery in Real GDP by State to its Q42019 level. NH, UT, WA, CA, and TN are the top 5 States in terms of recovery. It is worth noting how heterogeneous the recovery of Real GDP has been, with some States not even having fully recovered yet.
- How are the differences in inflation across geographies combined with the Fed’s tightening policies going to affect real estate prices, investment, consumer spending, and GDP in the respective regions?
- How are these differences captured by scenarios for forecasting credit quality of the bank’s assets, particularly for regional and community banks that operate in relatively local geographies?
Fig 11. Allowance-to-Loan Ratio for U.S. Banks
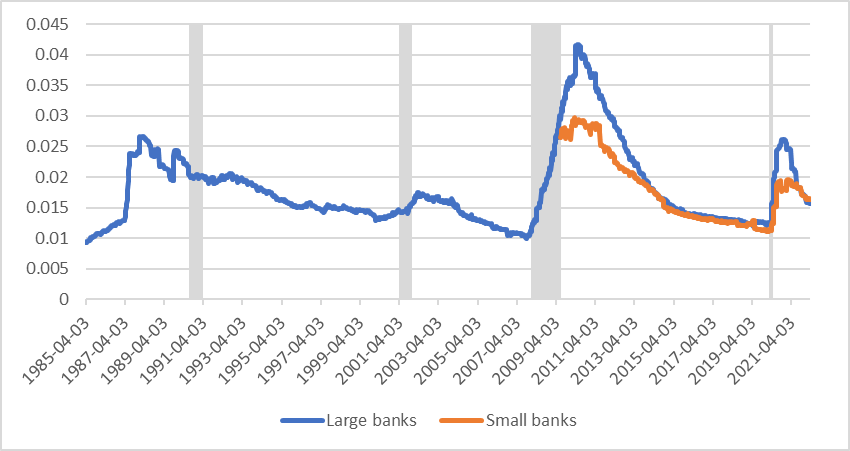
Fig 12. CPI y/y change (U.S. Bureau of Labor Statistics)
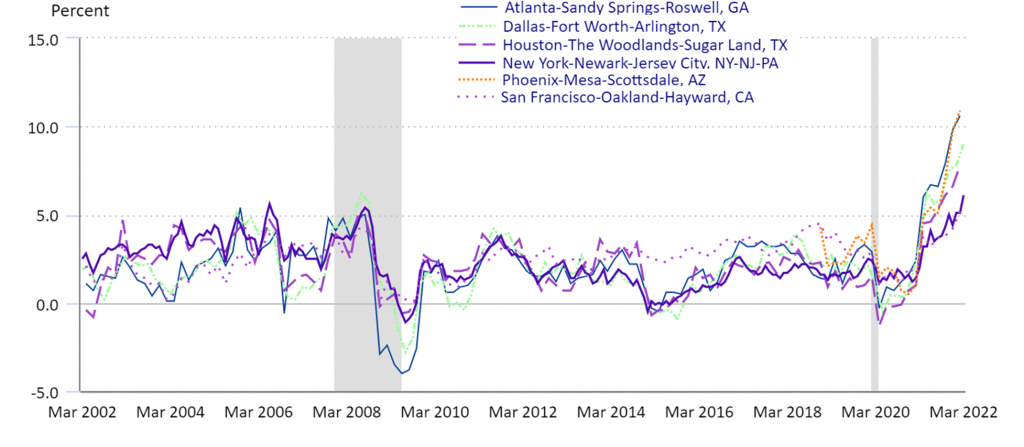
Fig 13. Recovery in Real GDP Post-Pandemic (rank of recovery)
Concluding Remarks
- The rising interest rates in the coming quarters due to the Fed’s policy actions will boost banks’ NIM which should lead to higher net interest revenue.
- The rise in the long end of the U.S. Treasury curve will affect the value of the banks’ securities (and fixed rate loans) which will impact tangible common equity and may lead to a reduction in capital depending on how the securities are classified.
- Loan growth will differ between Large and Small Banks: mainly C&I and Consumer loans for Large Banks, whereas mainly CRE and Consumer loans for Small Banks. Growth in RRE loans will slow down due to further deterioration in housing affordability from rising mortgage rates and home prices.
- The impact from the Fed’s policy actions and rising economic uncertainty has been reflected on the credit outlook for only some of the large banks, resulting in reserve increases for those banks.
- The above impact is expected to differ depending on the asset mix and region of each bank, because of the asymmetry in inflationary pressures and post-pandemic GDP recovery across geographies. Hence, it is important for banks to be using local scenarios that can capture such specificities for each asset class and use case, from CECL and stress testing to business planning.
Grigoris Karakoulas is the president and founder of InfoAgora (infoagora.com) that provides risk management consulting, predictive risk analytics, price optimization, scenario generation and CECL/stress testing solutions, and model validation services. Contact him at grigoris@infoagora.com